Translate this page into:
Use of patient sample for quality control of hematology analyzers: Is it a feasible option in resource-poor setting?
*Corresponding author: Manoj A. Kahar, Department of Hematology, Bhanumati Clinical, Navsari, Gujarat, India. manoj_kahar@yahoo.com
-
Received: ,
Accepted: ,
How to cite this article: Kahar MA. Use of patient sample for quality control of hematology analyzers: Is it a feasible option in resource-poor setting? J Hematol Allied Sci. 2023;3:54-60. doi: 10.25259/JHAS_5_2023
Abstract
Objectives:
The operation of hematology analyzers (HAs) is assured by quality control (QC) procedures. For internal QC, the use of stable hematology control material is recommended; however, its use has various limitations such as prohibitive cost, limited shelf life, and logistics. The aims of this study were to determine the utility and efficacy of patient samples in regular QC and HAs.
Material and Methods:
The patient’s samples were used for duplicate testing, comparability testing, and replicate testing along with X̅B monitoring to determine the performance of primary HA MEK 1900.
Results:
Paired t-test and correlation results in duplicate test and Scatter plot, Bland–Altman plot, and Passing– Bablok regression results derived from comparability studies revealed acceptable results as per recommendations. In replicate testing, acceptable coefficients of variation were obtained for hemoglobin (Hb) (1.6%), platelet count (4.9%), red blood cell (RBC) count (1.1%), and white blood cell (WBC) count (1.9%).
Discussion:
In duplicate sample testing paired t-test revealed P > 0.05. In 97% of samples, the standard deviation (SD) was <±2SD for duplicate testing for Hb, platelet count, RBC count, and WBC count. In comparability testing, for Hb, platelet count, RBC count, and WBC count, the correlation coefficient values were close to 1 and comparable to similar published studies. Results for repeatability studies in our study are within acceptable limits as per recommendations. X̅B monitoring revealed results acceptable within the prescribed limits by the manufacturer. The experiments done and results obtained in our study favor the use of patient samples to perform IQC for HA; however, it does not replace the use of stable commercial quality control material.
Conclusion:
In small-scale laboratories in resource-poor settings, patient samples can be of some use in QC of HA.
Keywords
Duplicate testing
Scatter plot
Bland–Altman
Passing–Bablok
Internal quality control

INTRODUCTION
Current hematology analyzers (HAs) have a high degree of precision, for cell counting and cell sizing. These HA need to be calibrated at regular intervals as per guidelines[1,2] and their operation is assured by quality control (QC) procedures.
QC of HA encompasses internal QC (IQC) using stable hematology control material and participating in external quality assurance programs (EQAP).
In resource-poor settings, it is not always feasible to use commercial controls due to prohibitive cost, limited shelf life, and issues related to logistics. As regards EQAP, results are received either monthly or quarterly from the program compromising its utility in dynamic and daily QC.
Considering the limitations of both IQC and EQAP/ proficiency testing (PT), the use of patient samples in evaluating and monitoring the analytical performance of HA is an attractive option. The present study was undertaken to determine the utility and efficacy of patient samples in regular QC of HAs.
MATERIAL AND METHODS
An observational retrospective study was performed in a reference laboratory at Navsari, Gujarat using 3 mL of patient’s whole blood collected in ethylenediaminetetraacetic acid (EDTA) container between May 2022 and October 2022 to evaluate the role of patient’s sample in QC of HA.
Retained patient sample testing (duplicate testing)
Randomly selected patient sample was rerun in primary HA, Celltac G MEK (9100), Nihon Kohden, Japan at the start of the morning shift every day from retained patient samples refrigerated overnight. Data from such 350 patient samples were used for statistical analysis for duplicate testing. EDTA anticoagulated blood sample is stable when refrigerated overnight and are suitable for such a QC purpose.[3-5] For the 350 samples used for duplicate testing, the lowest and highest values in the sample for the four parameters were (hemoglobin [Hb]: 5.3–18.7 g%, platelet count 16000–765000 cells/cumm, red blood cell [RBC] count 1.5–11.7 million/cumm, and white blood cell [WBC] count 1900–46800 cells/cumm).
Standard deviation (SD) was calculated for the differences between the 2 runs in duplicate testing from the first 20 samples. P-value was calculated using the paired t-test to assess the significance of the difference between the two runs.
If the duplicate tests differed from each other by more than 2SD, a random error was identified.[6] For acceptable performance, 95% of tests should have a deviation <±2SD.[7]
Comparability of results (reproducibility) between Celltac G MEK 9100 and XP-100 HA
One hundred and fifty random samples were first analyzed in the primary HA Celltac G, MEK 9100) and then rerun in secondary, HA (XP-100, Sysmex, Japan) within 1 h of collection. The data obtained were used for inter-instrument comparison.
Scatter plot, Bland–Altman plots, and Passing–Bablok regression were used for comparability studies between the HA used in our laboratory as per the recommendations.[8]
For comparability (correlation) studies, the 150 samples used had a wide range of results Hb (1.2–21.3 g%), RBC count (0.4– 6.8 million/cumm), WBC count (300–292000 cells/cumm), and platelet count (7000–1677000 cells/cumm) satisfying the published recommendations.[8]
Replicate testing
Once every week, a single sample was assayed 11 times for 11 weeks as per the established recommendations.[6,9] The coefficient of variation (CV) for each of these 11 samples for Hb, platelet count, RBC count, and WBC count was calculated and compared with recommended quality specifications in hematology.[10-12]
X̅B monitoring
X̅B monitoring of RBC indices using patient samples was recorded by the inbuilt software of HA MEK 9100. The target value was calculated from the average daily mean of the initial 2 weeks, that is, the full 12 working days.
On average, 110 samples were analyzed daily and the mean of mean corpuscular Hb, mean corpuscular Hb concentration, and mean corpuscular volume plotted against the target values and met the requirement for using X̅B.[9]
Statistical calculations
The calculations were performed using “MedCalc” statistical software (version 20) and the Statistical Package for the Social Sciences (version 26).
RESULTS
Retained patient sample testing (duplicate testing)
The paired t-test (P > 0.05) did not reveal any significant differences in the samples tested within 24 h for the differences in Hb, platelet count, RBC count, and WBC count.
The correlation result was as follows for Hb, platelet count, RBC count, and WBC count on Days 1 and 2, 0.998, 0.989, 0.997, and 0.994, respectively.
The standard deviation calculated on daily difference values were as follows for Hb (0.12), platelet count (15.32), RBC (0.06), and WBC (0.46).
Comparability testing (reproducibility) between MEK 9100 and XP 100
The results obtained for the comparability testing study on 150 samples on Scatter plot, Bland–Altman plot, and Passing–Bablok regression were as follows.
Scatter plots showed the following results [Figure 1]: The correlation of results (r) between days 1 and 2 measurements was as follows for Hb (r = 0.9811 [R2] = 0.96), Platelet count (r = 0.9759 [R2] = 0.94), RBC count (r = 0.9917 [R2] = 0.98), and WBC count (r = 0.9968 [R2] = 0.98).
Bland–Altman bias plot revealed results as follows [Figure 2]: For Hb (Limits of agreement −1.4–1.4 and mean of 0.0), platelet count (Limits of agreement −106.7–102.6 and Mean 2.0), RBC count (limits of agreement −0.34–0.29 and Mean −0.02), and WBC count (limits of agreement −6.2–7.0 and Mean −4.6).
Passing–Bablok regression revealed the following results, as shown in [Table 1].

- Scatter plot for comparability (correlation) of results for hemoglobin, platelet count, red blood cell count, and white blood cell count in 150 samples.
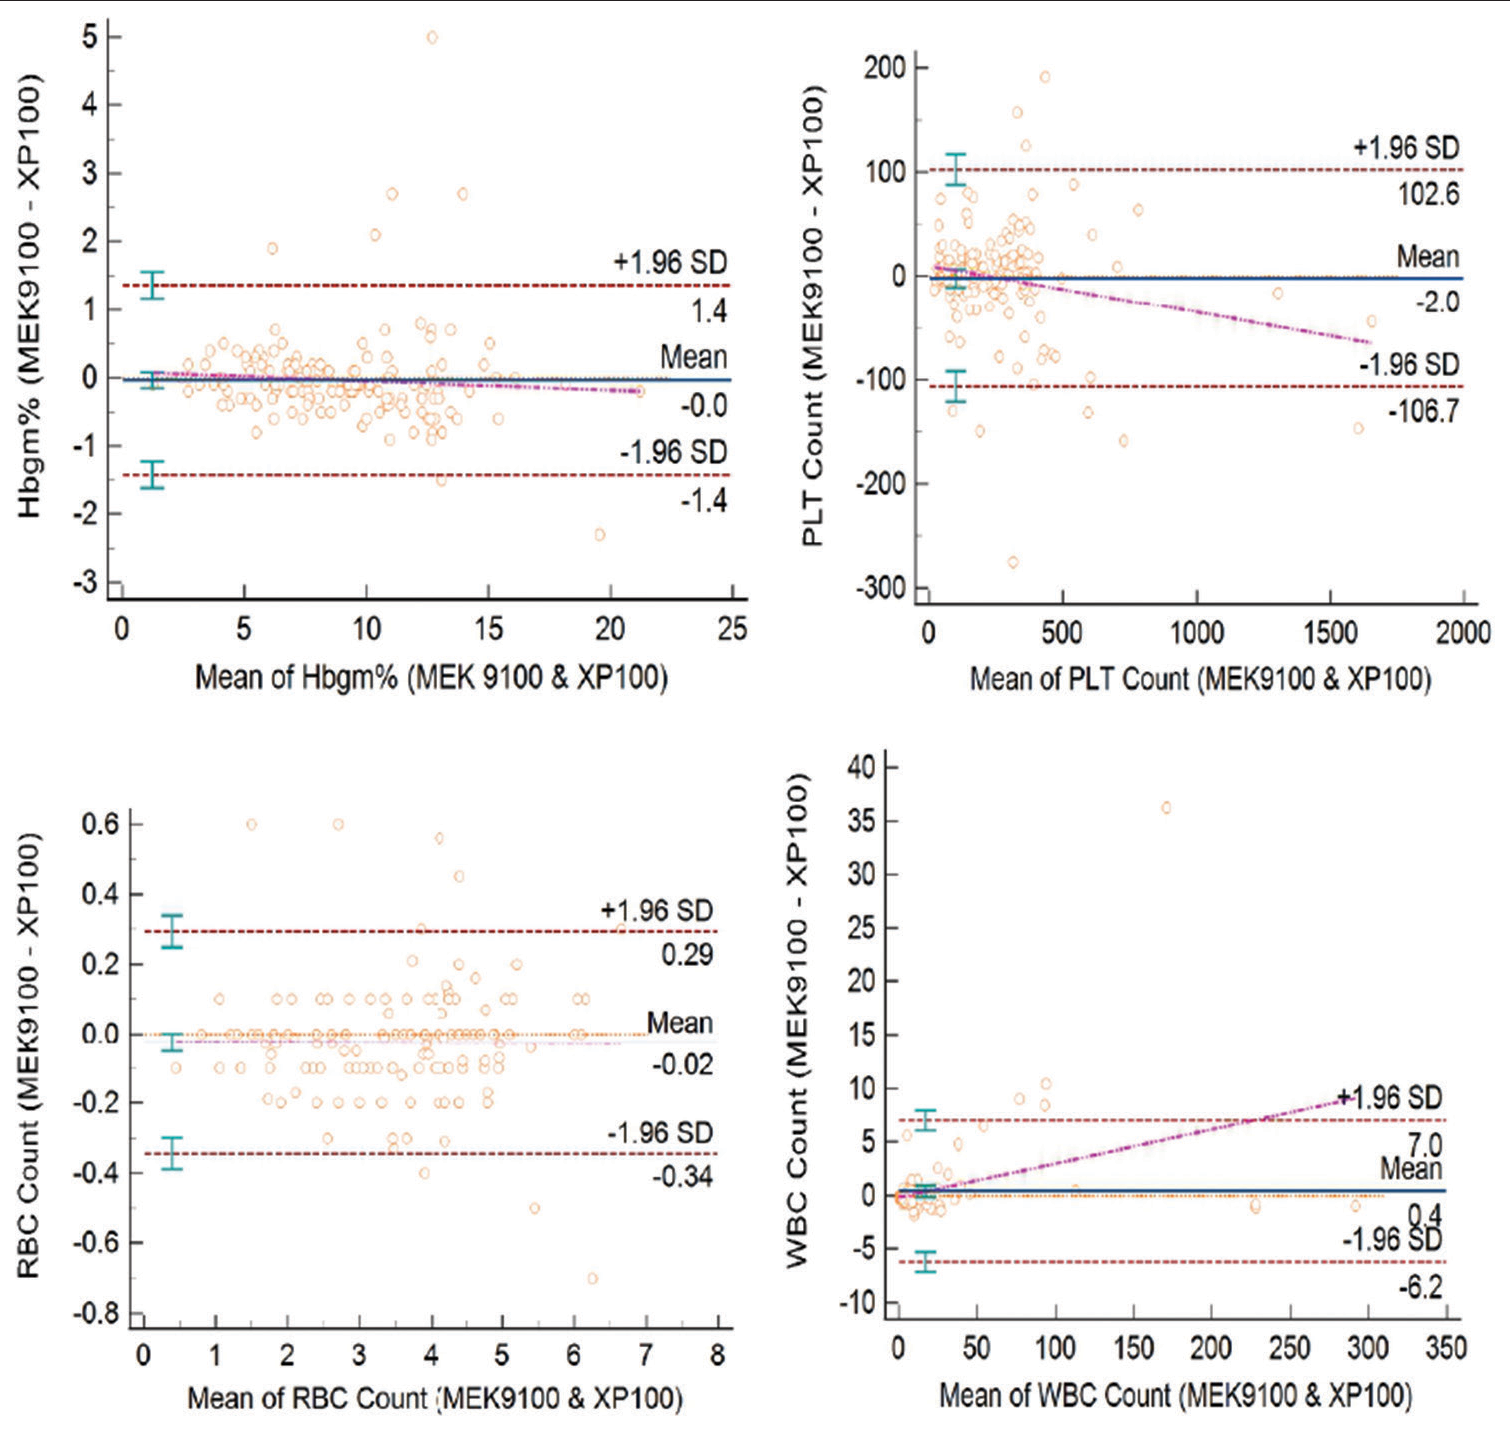
- Bland–Altman plot of hemoglobin, platelet, red blood cell count, and white blood cell count in 150 samples used for comparability.
| Hemoglobin | Platelet count | RBC count | WBC count | |
|---|---|---|---|---|
| Regression equation | y=−0.108974+1.025641x | y=−4.861608+1.011506x | y=0.000000+1.000000x | y=0.100000+1.00000x |
| Intercept at 95% confidence interval | 0.1090 | −4.8616 | 0.0000 | 0.1000 |
| Slope at 95% confidence interval | 1.0256 | 1.0115 | 1.0000 | 1.0000 |
| Spearman rank | 0.983 | 0.950 | 0.989 | 8.868 |
RBC: Red blood cell, WBC: White blood cell
Replicate testing (repeatability)
The results of 11 samples (each assayed 11 times within 1 h of collection within a batch) revealed CV of 1.73% for Hb, 4.94% for platelet count, 1.10% for RBC count, and 1.96% for WBC count.
X̅B monitoring results
Results of X̅B charts were daily monitored for outlier for RBC indices. On most of the days, the results were within the prescribed limits, as shown in [Figure 3].
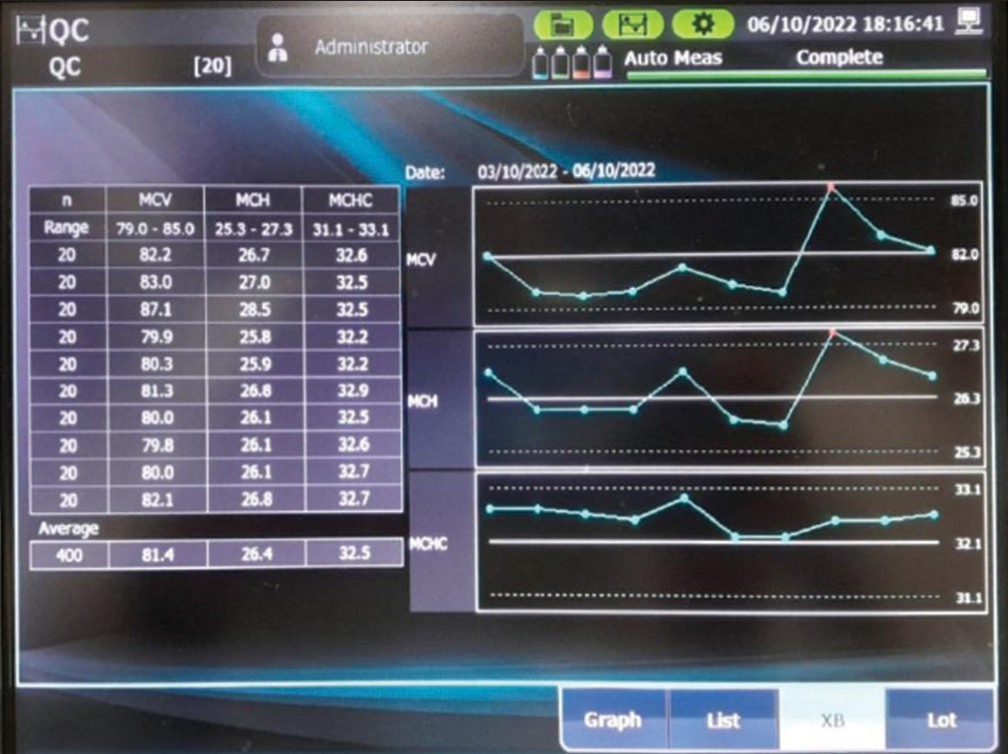
- Figure of X̅B chart from MEK 9100 analyzer.
DISCUSSION
IQC using stable control material is an essential component of quality assurance in clinical laboratories.[2]
However, the use of stable control material for IQC has its limitations in resource-poor laboratories in small-town places. These limitations consist of inventory management including timely supply, deterioration of control material due to improper handling and storage, spillage and breakage of control material vial, limited shelf life, prohibitive cost, contingencies (e.g., non-availability of QC material during the COVID-19 pandemic), etc. Moreover, there are issues of commutability with the stable QC material and they do not exactly match the patient’s samples.
Considering the above limitations of commercial IQC material, the use of patient blood samples for QC is feasible and cost-effective in resource poor setup.
The following experiments were done and the results obtained favor the use of the patient’s sample to do QC of HA.
Retained patient sample testing (duplicate testing)
Paired t-test results derived from 350 samples for the daily difference in results for Hb, platelet count, RBC count, and WBC count were >0.05 and showed acceptable performance.
About 97% of samples in our study showed a deviation <± in 2SD in daily difference in results of Hb, platelet count, RBC count, and WBC count. This is in accordance with recommendations (95% of samples should have <2SD in daily difference)[7] and ruled out random errors in the functioning of HA. Duplicate measurement detects random alterations in apparatus or reagents.
Comparability of results
The correlation coefficient obtained from the scatter plots for Hb, platelet, RBC count, and WBC count were, respectively, 0.9811, 0.9759, 0.9917, and 0.9968. As per the recommendation, all the correlation coefficient values are close to 1, and therefore, the data are “linear.”[8]
The statistical values for comparability (reproducibility) studies obtained in the present study were found to be comparable with similar studies published in the literature and are shown in [Table 2].
| S. No. | Study and year of publication | Jean et al. 2010[13] | Briggs et al. 2012[14] | Grillone et al. 2013[15] | Xiang et al. 2015[16] | Present study |
|---|---|---|---|---|---|---|
| 1. | Instruments used | DxH800 VS LH755 | XN VS XE-2100 | BC 6800 VS ABX pentra DX120 | BC-5000 VS XB-2100 | MEK 9100 VS XP-100 sysmex |
| Sample | 125 | 390 | 20 | 310 | 150 | |
| 2. | Range | |||||
| Hb (g/dL) | 5.14–17.14 | - | 0.5–20 | 6.4–17.5 | 1.2–21.0 | |
| Platelet count (109/L) | 8.2–1031 | - | 6.1–2000 | 23–691 | 14–1233 | |
| RBC count (1012/L) | 1.2–5.52 | - | 0.17–7 | 1.81–5.67 | 0.40–6.80 | |
| WBC count (109/L) | 2.43–21.78 | 0.14–200 | 1.37–58.9 | 0.30–189 | ||
| 3. | Linear regression equation | |||||
| Hb | y=1.005x+0.027 | - | - | y=1.0067x−0.1824 | y=−0.108974+1.025641X | |
| Platelet count | y=0.892x+10.75 | - | - | Y=1.0018x–2.3513 | y=−4.861608+1.011506x | |
| RBC count | y=0.992x+0.006 | - | - | y=1.0039x−0.0328 | y=0.000000+1.000000x | |
| WBC count | y=0.978x−0.009 | - | - | y=0.9847x−0.1321 | y=0.100000+1.000000x | |
| 4. | Intercept at 95% confidential regression analysis | |||||
| Hb | - | −0.05 | 0.7889 | - | 1.1090 | |
| Platelet count | - | - | −3.4899 | - | −4.8616 | |
| RBC count | - | −0.24 | −0.0008 | - | 0.0000 | |
| WBC count | - | −0.76 | −0.0893 | - | 0.1000 | |
| 5. | Slope at 95% confidential regression analysis | |||||
| Hb | - | 0.99 | 0.9280 | - | 1.0256 | |
| Platelet count | - | - | 0.8745 | - | 1.0115 | |
| RBC count | - | 1.05 | 0.9720 | - | 1.0000 | |
| WBC count | - | 1.07 | 0.8950 | - | 1.0000 | |
| 6. | R | |||||
| Hb | 0.998 | 0.99 | 0.998 | 0.9985 | 0.9811 | |
| Platelet count | 0.997 | - | 0.973 | 0.9856 | 0.9759 | |
| RBC count | 0.997 | 0.99 | 0.987 | 0.9963 | 0.9917 | |
| WBC platelet count | 0.997 | 0.99 | 0.995 | 0.9991 | 0.9968 |
Hb: Hemoglobin, RBC: Red blood cell, WBC: White blood cell
In Passing–Bablok interpretations, if the 95% confidence interval of the slope includes the value 1, then there is no significant proportional difference between methods. If the 95% confidence interval of the Y-intercept includes the value 0, then there is no constant difference between the two methods.[8] The result, as shown in [Table 1], satisfied the above recommendations and it can be inferred that there is no constant difference between the two HA analyzer MEK 9100 and XP 100 used in the study.
The Bland–Altman bias plot results, as shown in [Figure 2], were in an acceptable range and there was no statistically significant difference in results obtained for Hb, platelet count, RBC count, and WBC count.
Repeatability
Repeatability experiment in our study revealed CV % within the acceptable maximum acceptable imprecision as per recommendations[8] [Table 3a].
| Maximum % imprecision based on medical needs | State of the art | ≤0.5 within-subject biological variation | “Ricos” criteria | Imprecision of repeatability in the present study | |
|---|---|---|---|---|---|
| Hemoglobin | 2.0 | 0.6–1.2 | 0.8–1.5 | 1.43 | 1.67 |
| Platelet | 9.9 | 1.9–3.2 | 1.3–3.3 | 4.6 | 4.91 |
| RBC | 2.5 | 0.5–1.3 | 0.8–1.7 | 1.60 | 1.17 |
| WBC | 8.0 | 1.6–2.7 | 5.2–7.7 | 5.73 | 1.97 |
RBC: Red blood cell, WBC: White blood cell
Results of CV % obtained in experimental for within batch repeatability are comparable with other similar published studies and are shown in [Table 3b].
| S. No. | Within batch | Briggs et al. 2012[14] | Grillone et al. 2013[15] | Xiang et al. 2015[16] | Present study |
|---|---|---|---|---|---|
| 1. | HB | ||||
| Mean | - | 14 | 119 | 12.3 | |
| SD | - | 0.11 | 0.98 | 0.21 | |
| CV | - | 0.81 | 0.89 | 1.73 | |
| 2. | Platelet | ||||
| Mean | - | 274 | 290 | 307.9 | |
| SD | - | 5.03 | 4.34 | 13.53 | |
| CV | 4.0 | 1.84 | 3.13 | 4.94 | |
| 3. | RBC | ||||
| Mean | - | 4.71 | 3.8 | 5.00 | |
| SD | - | 0.04 | 0.07 | 0.05 | |
| CV | - | 0.92 | 1.7 | 1.10 | |
| 4. | WBC | ||||
| Mean | - | 9.28 | 9.94 | 9.10 | |
| SD | - | 0.16 | 0.21 | 0.16 | |
| CV | 8.6 | 1.70 | 2.10 | 1.96 |
Hb: Hemoglobin, RBC: Red blood cell, WBC: White blood cell,
CV: Coefficient of variation, SD: Standard deviation
X̅B results
Daily monitoring was done for X̅B results. Most of the days during the study period, the X̅B result was within the prescribed limits. If there was any deviation in the results for RBC indices root cause analysis was done, the causes were identified and appropriate action was taken as per the manufacturer’s instructions.
Pitfalls of IQC material
There are several pitfalls in the use of IQC material for QC of HA. First, these samples are usually manipulated to lengthen the shelf life; therefore, they may behave differently than ordinary patient material. Second, the manufacturer target’s limits are often very broad, and subtle changes in analyzer behavior may thus be missed. Therefore, it is recommended to adjust the target range after a run-in period of several measurements, for example, to the mean 2 SDs. A benefit in using these QC samples is that they may be used to judge the instrument precision over time (i.e., drift) using a Levey-Jennings graph; however, it must be kept in mind that, at the end of the shelf life, the quality of the control samples may deteriorate.[17]
To assure the harmonization of reported results between different analyzers and methods, an inter-instrument QC comparison is needed. Usually, this can be achieved by measuring patient samples (thereby avoiding the so-called matrix effect of stabilized QC samples) on these multiple systems and comparing the results. It is recommended that multiple HA are compared at least on a weekly basis, using at least three samples or more.[17]
CONCLUSION
Considering above discussion pertaining to results obtained in the present study, it can be inferred that for small-scale laboratories in resource-poor setting, patient’s samples can be of some use in evaluating the performance of automated HA.
The use of stable control materials and statistical quality control (SQC) still provides the best primary control mechanism and may be supplemented, but not replaced by patient data control. In small laboratories, where few patients sample are analyzed and it is difficult to analyze stable control materials, repeat patient tests might provide a useful control for monitoring variability.[18] It is always better to do something than nothing.
Limitations of the study
As per the recommendation in comparability testing,[8] wherever possible, at least 50% of the samples should be outside the laboratory reference interval. In the present study, 150 samples for duplicate testing were randomly selected and this particular recommendation may not have been followed.
R result range targeted for correlation should include equal thirds below, within, and above the normal reference interval. Above are guidelines and not absolute requirements; however, high and low ranges are most important from a medical perspective.[8] In the present study, the samples for correlation studies were randomly selected and may not match the above recommendations.
Ideally, the comparability between test results should be between the same generation of HA; however, our study (MEK 9100 5-part cell counter) was compared with an (XP-100 3-part cell counter).
Delta check current results compared with previous results were not evaluated as a method of QC using patient samples in the present study.
Acknowledgment
Ms. Rikita Vaghasiya and Ms. Neha Patel for their help in typing the manuscript and helping in preparing the reference list using the Mendeley reference manager.
Declaration of patient consent
Patient’s consent not required as patients identity is not disclosed or compromised.
Conflicts of interest
There are no conflicts of interest.
Financial support and sponsorship
Nil.
References
- Specific Criteria for Accreditation of Medical Laboratories NABL. Vol 112. Gurgaon: National Accrediation Board for Testing and Calibration Laboratories; 2016. p. :101.
- [Google Scholar]
- Medical Laboratories-Requirements for Quality and Competence (ISO 15189: 2012) Switzerland: International ISO Standard; 2012. p. :62.
- [Google Scholar]
- Stability of blood in commonly used anticoagulants. Use of refrigerated blood for quality control of the Coulter Counter Model S. Am J Clin Pathol. 1969;52:690-4.
- [CrossRef] [PubMed] [Google Scholar]
- Temperature-and storage-dependent changes in hematologic variable and peripheral blood morphology. Am J Clin Pathol. 1998;110:537.
- [Google Scholar]
- Refrigerated storage improves the stability of the complete blood cell count and automated differential. Am J Clin Pathol. 1999;112:687-95.
- [CrossRef] [PubMed] [Google Scholar]
- World Health Organization: Quality assurance in hematology, WHO, LAB 98.4 (WHO/LAB/98.4) Geneva: World Health Organization; 1998.
- [Google Scholar]
- Validation, Verification, and Quality Assurance of Automated Hematology Analyzers; H26- A2 Wayne, PA: Clinical and Laboratory Standards Institute; 2010.
- [Google Scholar]
- Diurnal change of blood count analytes in normal subjects. Am J Clin Pathol. 1996;106:723-7.
- [CrossRef] [PubMed] [Google Scholar]
- Evaluation of biologic sources of variation of leukocyte counts and other hematologic quantities using very precise automated analyzer. Am J Clin Pathol. 1978;69:48-54.
- [CrossRef] [PubMed] [Google Scholar]
- The new haematology analyzer DxH 800: An evaluation of the analytical performances and leucocyte flags, comparison with the LH 755. Int J Lab Hematol. 2011;33:138-45.
- [CrossRef] [PubMed] [Google Scholar]
- Performance evaluation of the Sysmex haematology XN modular system. J Clin Pathol. 2012;65:1024-30.
- [CrossRef] [PubMed] [Google Scholar]
- Evaluation of the fully automated hematological analyzer mindray BC 6800: Comparison with Horiba ABX Pentra DX120. Int J Lab Hematol. 2013;36:e55-8.
- [CrossRef] [PubMed] [Google Scholar]
- Evaluation of Mindray BC-5000 hematology analyzer: A new miniature 5-part WBC differential instrument. Int J Lab Hematol. 2015;37:597-605.
- [CrossRef] [PubMed] [Google Scholar]
- Verification and quality control of routine hematology analyzers. Int J Lab Hematol. 2016;38:100-9.
- [CrossRef] [PubMed] [Google Scholar]
- Quality control review: Implementing a scientifically based quality control system. Ann Clin Biochem. 2016;53:32-50.
- [CrossRef] [PubMed] [Google Scholar]