Translate this page into:
Evaluating the validity of the national list of essential medicines 2015 for medicines affecting blood in 2022: An observational cost analysis
*Corresponding author: H. Shafeeq Ahmed, Department of Medicine, Bangalore Medical College and Research Institute, Bengaluru, Karnataka, India. shafeeqahmed2002@gmail.com
-
Received: ,
Accepted: ,
How to cite this article: Ahmed HS. Evaluating the validity of the national list of essential medicines 2015 for medicines affecting blood in 2022: An observational cost analysis. J Hematol Allied Sci 2022;2:91-5.
Abstract
Objectives:
The study aims at evaluating the validity of the national list of essential medicines (NLEM) 2015 for medicines affecting blood in 2022. The study essentially aims at conducting a cost analysis that mainly compares the cost variation between the highest and lowest priced branded variants of the same.
Material and Methods:
The study takes into account the aforementioned two classes of “Medicines Affecting Blood,” which is 10.1–antianemia medicines and 10.2–medicines affecting coagulation. Data were collected from MedGuideIndia, a database of medicines marketed in India. Both cost ratio and percentage cost variations were calculated.
Results:
Under 10.1–Antianemia medicines, hydroxycobalamin 2 ml injection (500 mcg/1 ml) has the highest percentage cost variation at 1451.72% and folic acid 5 mg tablets have the lowest percentage cost variation at 20.45%. Under 10.2– medicines affecting coagulation, phytomenadione 1 ml injection (10 mg/1 ml) has the highest percentage cost variation at 3784.46% and heparin 2 ml injection (1000 IU) has the lowest percentage cost variation at 10.4%.
Conclusion:
This study essentially reasons the need for the central drugs standard control organization and NPPI to intervene and appropriately modify the NLEM 2015 and introduce stricter rules and regulations, while ensuring that the appropriate price caps are both enforced and maintained for essential medicines.
Keywords
Hematology
Anemia
Pharmacoeconomics
Coagulation
INTRODUCTION
The World Health Organization (WHO) introduced the concept of essential medicines in 1977.[1] Essential medicines are those that satisfy the priority healthcare needs of the population. They are selected with a specific emphasis on public health relevance, evidence on efficacy and safety, and comparative cost-effectiveness. Essential medicines are intended to be available within the context of functioning health systems at all times in adequate amounts, in the appropriate dosage forms, with assured quality and adequate information, and at a price, the individual and the community can afford.[2]
The WHO developed its very first essential medicines list (EML) in 1977 and since then, the list has been revised every 2 years. The current versions, updated in September 2021, are the 22nd EML.[3] This EML is merely a guide for individual nations, who can implement their national lists depending on the endemicity and prevalence of specific diseases in the population.
The Government of India, recognizing the importance of the EML, prepared and published its first national essential drugs list in 1996, which was revised in 2003 as the National List of Essential Medicines (NLEM).[4] The most recent NLEM was released in 2015.[5] The current list has 376 drugs. The medicines in NLEM should be available at affordable costs and with assured quality. The medicines used in the various national health programs, and emerging, and reemerging infections should be addressed in the list.[6] It was decided by the Core Committee that NLEM should be developed through a consultative and transparent process. Considering the healthcare structure of India, the essential medicines are to be classified targeting the levels of healthcare facilities.
Medicines affecting blood are essentially important in the case of several vascular and systemic diseases and pathophysiological states.[7] The NLEM 2015 has two classes of drugs in the category of “Medicines Affecting Blood,” which is 10.1–antianemia medicines and 10.2–medicines affecting coagulation. And these are important medications that may be taken by people from all walks of life, be it age, gender, occupation, ethnicity, and other sociodemographic facets.
With a specific emphasis on the COVID-19 pandemic, and the introduction of several newer medicines, and branded products, an evaluation of the NLEM 2015 is necessitated. The present study attempts at analyzing the costs of the different variants of the essential medicines in the category of “Medicines Affecting Blood,” to assess the cost variations of the different branded variants of the same.
MATERIAL AND METHODS
The study is of an analytical variety and does not use animals and/or human participants. The study takes into account the aforementioned two classes of “Medicines Affecting Blood,” which are 10.1–antianemia medicines and 10.2–medicines affecting coagulation.
In the present study, two sets, 10.1.2 ferrous salts and 10.1.3 ferrous salt (A) + folic acid (B), were excluded due to both ambiguity and the non-specific nature of both the medicine and dosage forms. All other drugs were included other than any drug variant either in the form of dose or formulation which did not have a competing brand with or without a different price which was excluded from the study. On the basis of the above, phytomenadione tablet 10 mg and warfarin tablet 3 mg were excluded from the study.
Data were collected from MedGuideIndia, a non-profit online website that collects up-to-date information on various aspects of healthcare, drugs, and insurance.[8]
The cost in Indian Rupee (INR/₹) of the different branded generic drugs of the same formulations and combinations was collected and compared. The study conducted the cost ratio comparison using data from the above-mentioned sources. Cost ratios are defined as the ratio of prices of the highest priced branded generic formulation and lowest priced branded generic formulation of a drug with the same formulation, dose, and dosage forms.[9] Cost ratios give us the data on the number of times the most expensive formulation is priced in comparison to the cheapest formulation.
The cost ratio was calculated using the following formula;
The percentage cost variation was calculated using the formula:
Both cost ratio and percentage cost variation are taken unto two decimal points.
The data obtained were then analyzed using descriptive statistics.
RESULTS
The data collected from the previously mentioned sources were analyzed, tabulated, and graphed. A total of 19 variations of the drugs were considered, seven drugs under 10.1– antianemia medicines and 12 drugs under 10.2–medicines affecting coagulation. The cost ratios and percentage cost variations were then further analyzed and compared.
[Table 1] contains the drug generic names, dose, formulation, maximum and minimum branded generic prices, and the percentage cost variation, calculated using the formula mentioned.
| NLEM No.1 | Drug Name | Dose | Formulation (No. per Unit) | Lowest Priced Brand | HIghest Priced Brand | Cost Ratio | Percen Cost Variatio (%) |
|---|---|---|---|---|---|---|---|
| 10.1–antianemia medicines | |||||||
| 10.1.1 | Erythropoietin | 2000 IU | Injection (1 Vial) | 366.88 | 990 | 2.70 | 169.84 |
| 10000 IU | Injection (1 Vial) | 1320 | 4600 | 3.48 | 248.48 | ||
| 10.1.4 | Folic acid | 5 mg | Tablets (10) | 13.25 | 15.96 | 1.20 | 20.45 |
| 10.1.5 | Hydroxycobalamin | 500 mcg/1 ml | Injection (2 ml) | 5.8 | 90 | 15.52 | 1451.72 |
| 1000 mcg/1 ml | Injection (1 ml) | 16 | 90 | 5.63 | 462.50 | ||
| 10.1.6 | Hydroxyurea | 500 mg | Capsules (10) | 70.55 | 157 | 2.23 | 122.54 |
| 10.1.7 | Iron Sucrose | 20 mg/1 ml | Injection (1 ml) | 100 | 150 | 1.50 | 50.00 |
| 10.2- Medicines Affecting Coagulation | |||||||
| 10.2.1 | Enoxaparin | 40mg/0.4 ml | Injection (0.4 ml) | 224.28 | 902 | 4.02 | 302.18 |
| 60 mg/0.6ml | Injection (0.6 ml) | 243.78 | 1157 | 4.75 | 374.61 | ||
| 10.2.2 | Heparin | 1000 IU | Injection (1 ml) | 27 | 32.5 | 1.20 | 20.37 |
| 1000 IU | Injection (2 ml) | 6.25 | 6.9 | 1.10 | 10.40 | ||
| 1000 IU | Injection (5 ml) | 35 | 90 | 2.57 | 157.14 | ||
| 10.2.3 | Phytomenadione | 10 mg/1 ml | Injection (1 ml) | 5.02 | 195 | 38.84 | 3784.46 |
| 10.2.4 | Protamine | 10 mg/1 ml | Injection (1 ml) | 29 | 69.5 | 2.40 | 139.66 |
| 10.2.5 | Tranexamic acid | 500 mg | Tablets (10) | 42.9 | 178.45 | 4.16 | 315.97 |
| 100 mg/1 ml | Injection (5 ml) | 18.59 | 315 | 16.94 | 1594.46 | ||
| 10.2.6 | Warfarin | 1 mg | Tablets (10) | 10 | 26.41 | 2.64 | 164.10 |
| 2 mg | Tablets (10) | 12 | 43.84 | 3.65 | 265.33 | ||
| 5 mg | Tablets (10) | 5.25 | 37.3 | 7.10 | 610.48 | ||
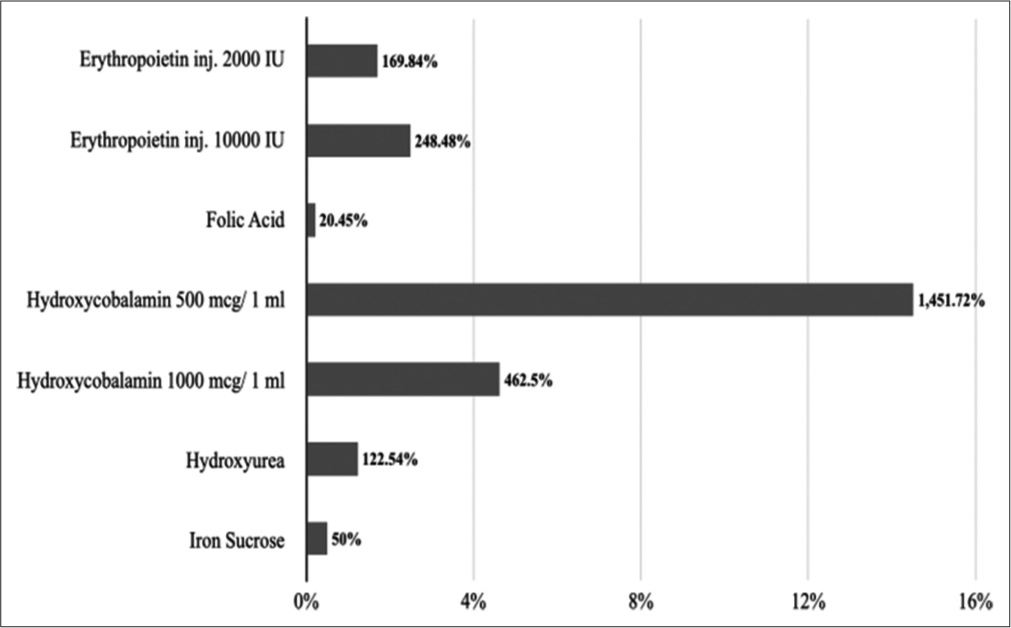
Under 10.1–antianemia medicines, hydroxycobalamin 2 ml injection (500 mcg/1 ml) has the highest percentage cost variation at 1451.72% followed by hydroxycobalamin 1 ml injection (1000 mcg/1 ml) at 122.54%. Folic acid 5 mg tablets have the lowest percentage cost variation at 20.45% followed by iron sucrose 1 ml injection (20 mg/1 ml) at 50%. The average percentage cost variation was 360.79%. [Figure 1] represents the percentage cost variation of 10.1–antianemia medicines.

- Percentage cost variations of 10.1–antianemia medicines.
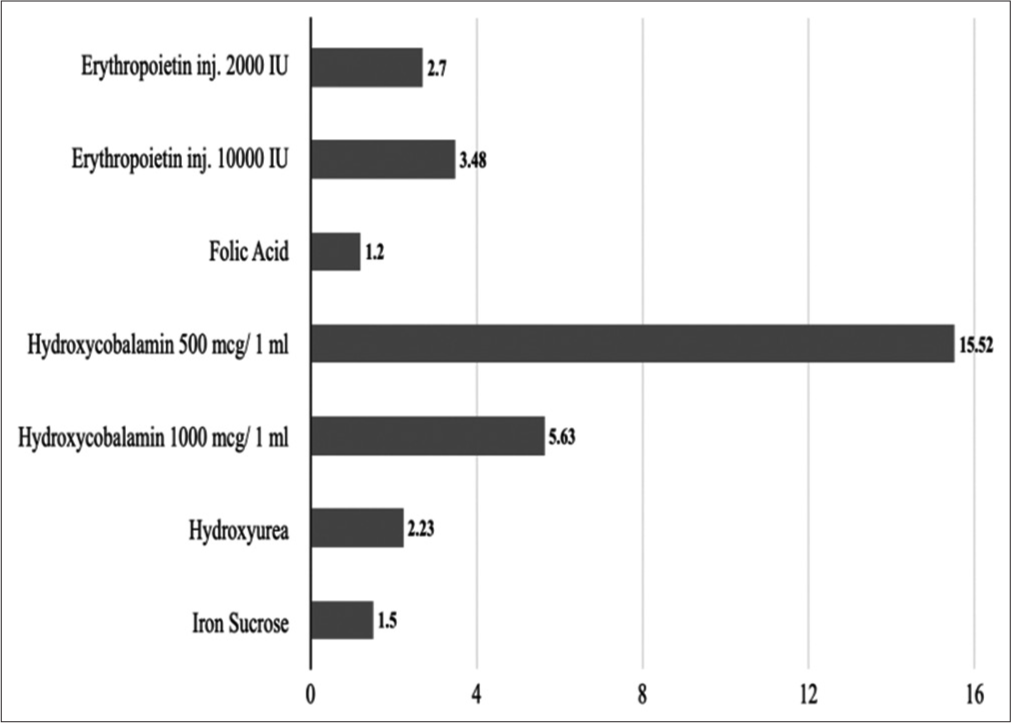
Along the same lines, hydroxycobalamin 2 ml injection (500 mcg/1 ml) has the highest cost ratio at 15.52 followed by hydroxycobalamin 1 ml injection (1000 mcg/1 ml) at 5.63. Folic acid 5 mg tablets have the lowest cost ratio at 1.2 followed by iron sucrose 1 ml injection (20 mg/1 ml) at 1.5. The average cost ratio was 4.6. [Figure 2] represents cost ratios of 10.1–antianemia medicines.

- Cost ratios of 10.1–antianemia medicines.
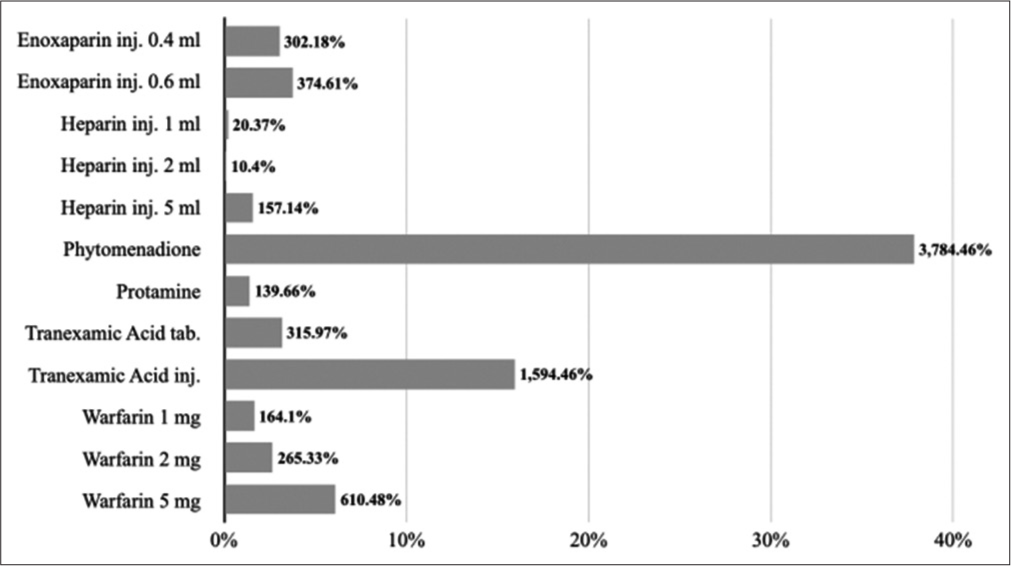
Under 10.2–medicines affecting coagulation, phytomenadione 1 ml injection (10 mg/1ml) has the highest percentage cost variation at 3784.46% followed by tranexamic acid 5 ml injection (100 mg/1ml) at 1594.46%. Heparin 2 ml injection (1000 IU) has the lowest percentage cost variation at 10.4% followed by heparin 1 ml injection (1000 IU) at 20.37%. The average percentage cost variation was 644.92%. [Figure 3] represents a percentage cost variation of 10.2– medicines affecting coagulation.

- Percentage cost variations of 10.2–medicines affecting coagulation.
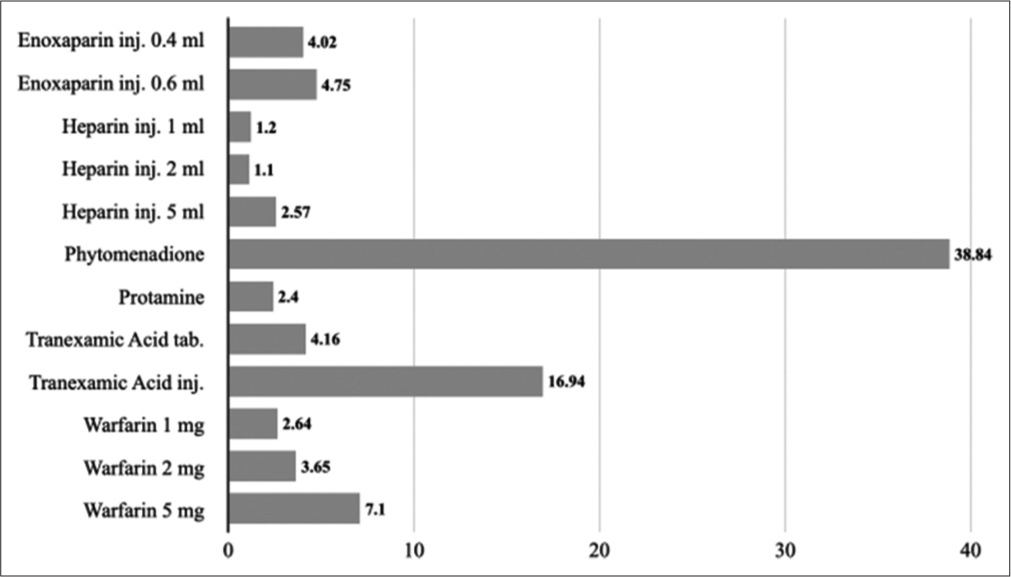
Similarly, phytomenadione 1 ml injection (10 mg/1 ml) has the highest cost ratio at 38.84 followed by tranexamic acid 5 ml injection (100 mg/1 ml) at 16.94. Heparin 2 ml injection (1000 IU) has the lowest cost ratio at 1.1 followed by heparin 1 ml injection (1000 IU) at 1.2. The average cost ratio was 7.44. [Figure 4] represents cost ratios of 10.2–medicines affecting coagulation.

- Cost ratios of 10.2–medicines affecting coagulation.
DISCUSSION
The NLEM 2015 has not been revised in almost 7 years, since its introduction. The last revision was done after 2011 in 2015, based on an order issued by the Supreme Court of India.[6] Several modifications have been made to the same, but the validity of the NLEM 2015 is what is brought into question in the present study.
As we have shown in [Table 1], the cost ratios range from 1.2 to 38.84. This entails that in the case of some drugs in NLEM 2015, the higher priced variant is more than 38 times more expensive than the cheapest variant. This is a cause for concern, as “comparative cost-effectiveness” is one of the core principles of EMs since 1977, and 45 years since, we are still unable to satisfy this requirement.
In India, studies that compare the cost of the same drug sold under different brand names by different pharmaceutical companies are few. For this reason, this study was undertaken to compare the cost of different brands of drugs under Section 10 of NLEM 2015. Moreover, several of the drugs under Section 10 are given for prolonged periods, which may even be a lifetime, and may affect the mortality and morbidity in patients with several vascular and hematological diseases.
This study, further, necessitates the intervention by the appropriate authorities, the Central Drugs Standard Control Organization (CDSCO) and the National Pharmaceutical Pricing Authority (NPPA). The main goal of the NPPA is to be a “Regulator for pricing of drugs and to ensure availability and accessibility of medicines at affordable prices.”[10] As can be seen from this study, some drugs such as phytomenadione 1 ml injection (10 mg/1 ml) and tranexamic acid 5 ml injection (100 mg/1 ml), have percentage cost variations at 3784.46% and 1594.46%, respectively, urgent action is required.
The drug price control order (DPCO) is an order issued by the Government of India, to fix the prices of the drug. Drugs that come under the DPCO cannot be sold at a price higher than that fixed by the government. In India, in 1979, 80–85% of the drugs in the market were under price control, and in recent years, this number has slowly decreased, and by 2002, only 15–20% of drugs were under price control.[11]
As can be seen from a randomized controlled trial by Jose et al.,[12] these medications are used in pregnant women as well, leading toward the conclusion that the at-risk groups are also concerned concerning the aforementioned medications. Anemia is widespread in India with 58.6% of children, 53.2% of non-pregnant women, and 50.4% of pregnant women who were found to be anemic in 2016, as per the National Family Health Survey.[13] This high prevalence is also associated with high requirements for iron supplements, especially in the pregnant population.
Another limitation of NLEM 2015 is that several formulations, doses, and dosage forms available in the market were excluded from the list.[5] This is further worrying and needs appropriate rectification by the core committee responsible for drafting the NLEM.
With the economic impact of the COVID-19 pandemic lasting more than 2 years, the financial issues attributed to patients have, further, increased.[14] For this reason, the urgency of the situation needs to be noted by the NPPA and the CDSCO.
Higher medication costs are a reason for medication non-adherence and are related to an increase in adverse health outcomes.[15] Medication non-compliance can be one of the single most common reasons for treatment failure. Non-compliance with the drug therapy results in the progression of the disease which increases the overall medical care costs dramatically. The treatment with generic drugs has been found to have fewer adverse clinical outcomes and improved treatment adherence than treatment with more expensive brand name versions. Das et al.[16] and Gallelli et al.[17] identified that generics and branded variants are equally effective in chronic conditions and other conditions, respectively.
One of the advantages of this study is that it uses a relevant government document, the NLEM 2015 as a reference for cost analysis, and also uses MedGuideIndia instead of the current index of medical specialties as the database, which has more up-to-date information than the latter.
The limitation of the study is the exclusion of 10.1.2 ferrous salts and 10.1.3 ferrous salt (A) + folic acid (B). We have not compared the iron supplements and molecules due to the diverse nature of their combinations which would saturate the current paper.
CONCLUSION
The study mainly discusses the large price variations between the lower and higher branded variants of “Medicines Affecting Blood.” Increased treatment adherence can be ensured by maintaining appropriate costs ensuring both affordability and accessibility. This study essentially reasons the need for the CDSCO and NPPI to intervene and appropriately modify the NLEM 2015 and introduces stricter rules and regulations while ensuring that the appropriate price caps are both enforced and maintained for essential medicines.
Declaration of patient consent
Patient’s consent not required as there are no patients in this study.
Financial support and sponsorship
Nil.
Conflicts of interest
There are no conflicts of interest.
References
- Essential medicines and health products information portal. J Pharmacol Pharmacother. 2014;5:74-5.
- [CrossRef] [PubMed] [Google Scholar]
- Concept of essential medicines and rational use in public health. Indian J Community Med. 2010;35:10-3.
- [CrossRef] [PubMed] [Google Scholar]
- WHO Model Lists of Essential Medicines. Geneva: World Health Organization; Available from: https://www.who.int/groups/expert-committee-on-selection-and-use-of-essential-medicines/essential-medicines-lists [Last accessed on 2022 Jun 07]
- [Google Scholar]
- National list of essential medicines of India: The way forward. J Postgrad Med. 2012;58:68-72.
- [CrossRef] [PubMed] [Google Scholar]
- National Informatics Centre. Available from: https://www.cdsco.nic.in/WriteReadData/NLEM-2015/NLEM,%202015.pdf [Last accessed on 2022 Jun 07]
- [Google Scholar]
- National List of Essential Medicines (NLEM) 2015. Available from: https://main.mohfw.gov.in/sites/default/files/Recommendations.pdf [Last accessed on 2022 Jun 07]
- [Google Scholar]
- Drugs that affect blood coagulation, fibrinolysis, and hemostasis In: Side Effects of Drugs Annual. Amsterdam: Elsevier; 2015. p. :419-32.
- [CrossRef] [Google Scholar]
- Your Ultimate Medicine Guide. Karnataka: Medguideindia.com; Available from: https://www.medguideindia.com/index.php [Last accessed on 2022 Apr 12]
- [Google Scholar]
- A cost variation analysis of drugs available in the Indian market for the management of thromboembolic disorders. Cureus. 2020;12:e7964.
- [CrossRef] [Google Scholar]
- About National Pharmaceutical Pricing Authority. New Delhi: National Informatics Centre; Available from: https://www.nppaindia.nic.in/en/about-us/about-national-pharmaceutical-pricing-authority [Last accessed on 2022 Jun 08]
- [Google Scholar]
- Antimicrobial price variation: Conundrum of medical profession! J Postgrad Med. 2007;53:72-4.
- [CrossRef] [PubMed] [Google Scholar]
- Comparison of ferric Carboxymaltose and iron sucrose complex for treatment of iron deficiency anemia in pregnancy-randomised controlled trial. BMC Pregnancy Childbirth. 2019;19:54.
- [CrossRef] [PubMed] [Google Scholar]
- Time trends in prevalence of anaemia in pregnancy. Indian J Med Res. 2018;147:268-77.
- [CrossRef] [PubMed] [Google Scholar]
- Health, psychosocial, and economic impacts of the COVID-19 pandemic on people with chronic conditions in India: A mixed methods study. BMC Public Health. 2021;21:685.
- [CrossRef] [PubMed] [Google Scholar]
- Adherence and health care costs. Risk Manag Healthc Policy. 2014;7:35-44.
- [CrossRef] [PubMed] [Google Scholar]
- Generic versus branded medicines: An observational study among patients with chronic diseases attending a public hospital outpatient department. J Nat Sci Biol Med. 2017;8:26-31.
- [CrossRef] [PubMed] [Google Scholar]
- Safety and efficacy of generic drugs with respect to brand formulation. J Pharmacol Pharmacother. 2013;4:S110-4.
- [CrossRef] [PubMed] [Google Scholar]


