Translate this page into:
Expression of Wilms tumor one gene, cyclin D1, and p53 in acute leukemia – An immunohistochemical study in a tertiary care center from North India
*Corresponding author: Prerna Arora, Department of Pathology (Hematology), Maulana Azad Medical College, New Delhi, India. drprernaarora27@gmail.com
-
Received: ,
Accepted: ,
How to cite this article: Bellichukki P, Arora P, Garg S. Expression of Wilms tumor 1 gene, cyclin D1, and p53 in acute leukemia – An immunohistochemical study in a tertiary care center from North India. J Hematol Allied Sci. 2024;4:16-22. doi: 10.25259/JHAS_8_2024
Abstract
Objectives:
Various genetic abnormalities affect the expression pattern of key genes involved in acute leukemia (AL). Wilms’ tumor gene 1 (WT1) is overexpressed in 70–90% of AL and is considered an adverse prognostic factor. Little is known about the role of cyclin D1 in AL. Genotyping of p53 is relatively common; however, in resource-limited settings, p53 protein expression by immunohistochemistry (IHC) can be a sensitive and specific tool for p53 mutations and copy number alterations in AL.
Material and Methods:
In this study, we set out to analyze the IHC expression of WT1, cyclin D1, and p53 in AL and correlate the expression with various clinico-hematologic parameters.
Results:
Thirty-five cases of AL were analyzed. WT1 expression was observed in 31% (11/35), while cyclin D1 and p53 expression was present in 5.7% (2/35) and 43 % (15/35) of leukemic blasts. WT1 expression was significantly associated with male sex, young age group, bleeding manifestation, and presence of splenomegaly. The absence of cyclin D1 expression was seen in all cases of acute lymphoblastic leukemia and 92.3% of acute myeloid leukemia with significant association with age and gender. Only seven cases of AL revealed positive p53 expression. No statistically significant association of p53 was noticed with age, gender, organomegaly, or lymphadenopathy.
Conclusion:
To the best of our knowledge, the diagnostic utility of WT1, cyclin D1, and p53 expression in AL using IHC has not been reported previously, especially from the Indian subcontinent.
Keywords
Acute leukemia
Cyclin D1
Immunohistochemistry
p53
Wilms tumor

INTRODUCTION
Leukemia constitutes 3% of the global cancer burden, and its prevalence is increasing slowly and steadily. The incidence of leukemia is highest in North America and Australia/New-Zealand and lowest in sub-Saharan Africa.[1] Many genetic abnormalities belonging to transcription factors, cell signaling molecules, cycle regulatory proteins, tumor suppressors, or proto-oncogenes promote malignant change. Wilms tumor gene (WT1) encodes a zinc finger transcription factor that regulates genes involved in nephrogenesis and hematopoiesis.[2-4] WT1 is considered an oncogene as well as a tumor suppressor in acute leukemia (AL).[5] Alterations of WT1 expression have been described in a number of malignancies. However, there is a lack of studies elucidating its molecular mechanism and expression in AL. WT1 overexpression has been reported in 80– 90% of acute myeloid leukemia (AML) and 70–90% of acute lymphoblastic leukemia (ALL), with an even higher frequency at relapse.[6] WT1 has also been demonstrated to interact with p53, where the ratio of WT1/p53 serves as a hallmark of the patient’s responsiveness to chemotherapy in AL.[7] However, limited literature reviews have been found determining the immunohistochemical (IHC) expression of WT1 in AL. Cyclins play an important role in the regulation of the cell cycle.[8] Cyclin D1 over-expression is predominantly associated with human tumorigenesis and metastases and is reported in several solid malignancies, but very little is known about its involvement in AL.[9] High expression of cyclin Dl protein leads to a poor prognosis in childhood ALL;[10] however, limited work has been done in AML. The present work is aimed at studying the IHC expression of WT1, cyclin D1, and p53 in AL patients at diagnosis and evaluates the correlation between each marker with varied clinicopathological parameters. To the best of our knowledge, studies concerning the IHC expression of WT1, cyclin D1, and p53 in AL are few and have not been previously studied.
MATERIAL AND METHODS
This was an observational prospective study conducted over a period of 1 year at the tertiary teaching institute in North India. The study was approved by the Institutional Ethics Committee (F.No. 17/IEC//2018), and written informed consent was taken from all the participants.
A total of 35 newly diagnosed cases of AL were enrolled in the study. The clinical history and other details were taken from the case files. Giemsa-stained peripheral smears and bone marrow (BM) aspirate smears were examined. Cytochemistry was available in all the cases for subtyping. The diagnosis of AL was based on the presence of 20% or more blast cells. The AML cases were further differentiated based on French American–British (FAB) criteria. BM sample for flow cytometry (FCM) was collected at the time of the BM aspiration in dipotassium Ethylene Diamine Tetra Acetic Acid (EDTA) vacutainer.
Further, diagnosis and subtyping were performed by FCM within 24 hours of sample collection on a 2-laser, 6-color Beckman Flow cytometer (FC500). The samples were processed as per standard protocol using the stain-lyse-wash method. Bone marrow biopsy (BMB) was studied in all cases and was fixed in 10% buffered neutral formalin for 24 hours, decalcified at 14.28% EDTA solution for 48 hours, and stained with hematoxylin and eosin. 5 mm thick paraffin sections were cut onto coated slides and utilized for IHC. Tissue sections were stained with anti-N-terminus WT1 (1:100 dilution; rabbit monoclonal antibody, clone EP 122, Pathnsitu), cyclin D1 (rabbit monoclonal antibody prediluted, Biogenex, Hyderabad, India), and p53 (1:100 dilution; mouse monoclonal antibody, clone BP-53-12 Pathnsitu) using a standard IHC protocol and an avidin-biotin-based detection system, with appropriate positive and negative controls (Wilm’s tumor was used as the positive control for WT1, breast carcinoma cases were taken as positive control for p53 and cyclin D1, and BMB from immune thrombocytopenia was taken as negative control). Definite nuclear immunostaining blasts were considered a positive result for WT1, cyclin D1, and p53. Staining intensity was graded on a scale from 0 to 3 (0 negative, 1 weak, 2 moderate, and 3 intense staining). Enumeration of positively stained blasts in three hot spot areas was performed at ×400 magnification, and an average percentage of positive cells among the total nucleated was calculated. The final score for WT1, cyclin D1, and p53 was calculated by multiplying both the intensity and percentage of positive cells. A final score of <10 % was considered negative for WT1 and cyclin D1, while for p53, a final score of <5 % was considered negative. The expression pattern of WT1, cyclin D1, and p53 expression was correlated with the clinico-hematologic parameters such as age, sex, clinical features, hemoglobin (Hb), white blood cell (WBC) count, platelet count, and BM blasts.
Statistical analysis
The data were compiled and analyzed using Microsoft Excel (R) Office 365, GraphPad Prism 8.4.2, and Statistical Package for the Social Sciences version 25. Descriptive statistics were presented in the form of proportions/percentages for categorical variables and mean and standard deviation for continuous data variables. Fisher Exact test/Chi-square test was used for the comparison of proportions (Categorical variables). Continuous variables were analyzed using the Mann–Whitney test/student T-test (Independent group/Unpaired data) and Wilcoxon sign-rank test/Paired t-test (for paired data) based on the normality of the data. Correlation between parameters was done using Pearson R or Spearman Rho basis the distribution of outliers and normalcy of data. P < 0.05 was considered significant.
RESULTS
Thirty-five cases of AL (n = 35) were included, out of which 54% (19/35) were ALL and 37% (13/35) were AML. Two cases were diagnosed as mixed phenotype acute leukemia (MPAL), while there was only one case of undifferentiated AL. The average age of the study cohort was 18.5 years (median 15 years, range 1–62) and consisted of 74% males. The most common complaint was fever in 94.2% (33/35) patients, followed by splenomegaly in 54.2% (19/35). Table 1 depicts the clinical characteristics and distribution of all cases and subgroups of diagnosis. Leukemic blasts expressed WT 1 in 31 % (11/35) of cases, cyclin D1 in 5.7% (2/35), and p53 expression in 43% (15/35) of AL cases. The maximum median score of WT1 and cyclin D1 was found in MPAL, while the minimum score was seen in undifferentiated AL. The lowest median score of p53 was seen in undifferentiated AL.
| Total number of acute leukemia cases (n=35) | |||||
|---|---|---|---|---|---|
| GENDER (%) | |||||
| Males | 26 (74.2) | Females | 9 (25.8) | ||
| AGE (%) | |||||
| 0–15 years | 18 (51.4) | 16–40 years | 12 (34.2) | >40 years | 5 (14.4%) |
| CLINICAL FEATURES (%) | |||||
| Fever | 33 (94.2) | Bone pain | 5 (14.2) | Bleeding | 14 (40) |
| Hepatomegaly | 16 (45.7) | Splenomegaly | 19 (54.2) | Lymphadenopathy | 16 (45.7) |
| HEMOGRAM (%) | |||||
| Hb g/dL (Median) | 7 | WBC×109/L (Median) | 10040 | Platelet count (Median) | 32000 |
| DISTRIBUTION OF CASES (%) | |||||
| ALL | 19 (54.2) | AML | 13 (37.1) | ||
| B–ALL | 17 (48.5) | MO | 2 (5.7) | M1 | 4 (11.4) |
| T–ALL | 2 (5.7) | M2 | 1 (2.8) | M3 | 3 (8.5) |
| Mixed phenotypic AL | 2 (5.7) | M4 | 1 (2.8) | M5 | 1 (2.8) |
| Undifferentiated AL | 1 (2.8) | M6 | 0 | M7 | 1 (2.8) |
ALL: Acute lymphoblastic leukemia, B-ALL: B-cell acute lymphoblastic leukemia, T-ALL: T-cell acute lymphoblastic leukemia, Hb: Hemoglobin, AL: Acute leukemia, AML: Acute Myeloid Leukemia.
WT1 expression in AL
WT1 expression was observed in 31% of AL cases. WT1 score ranged from 2-80, with the highest median expression in MPAL (42.5) followed by undifferentiated AL (3); however, the association was not found to be statistically significant [Figure 1a]. WT1 expression was distributed almost equally between ALL and AML in 31.7% and 30.7%, respectively, with a median WT1 Score of 6. Out of a total of 17 cases of B ALL, WT1 expression was found in 5 (29.4 %) cases and this association was found to be statistically significant (P = 0.0182). The majority of cases of B ALL (70.5%, 12/17) were found to be WT1 negative, and among AML cases, all cases diagnosed as acute promyelocytic leukemia did not reveal WT1 expression and this was found to be statistically significant (P = 0.0253). In one case each of AML FAB M1, M2, M5, and M7 was observed to show positive WT1 expression [Figure 1b]. WT1 expression was also found to be significantly associated with male sex (P = 0.006) and young age group 0–15 years (P = 0.0085). About 54.5% of cases having bleeding manifestation revealed WT1 positive expression, and this was significant (P = 0.049); similarly, 72.7% of patients having splenomegaly revealed WT1 positivity (P = 0.0004). WT1 expression did not differ with the presence of hepatomegaly or lymphadenopathy, WBC, platelet count, and Hb level or blast percentage.
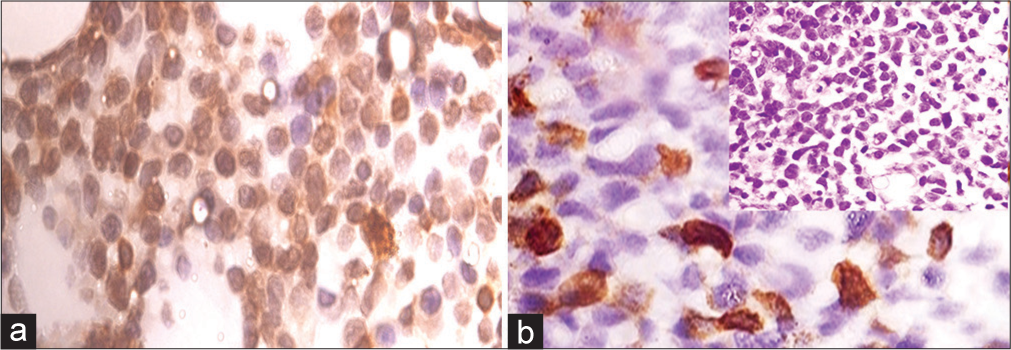
- (a) Representative core biopsy stained with WT1 antibody-MPAL WT1 score = 80, ×1000 magnification (b) AML M7, WT1 score = 20, ×1000 magnification: inset bone marrow biopsy AML M7 (Hematoxylin and Eosin ×400 magnification). AML: Acute myeloid leukemia, WT1: Wilms’ tumor gene 1, MPAL: Mixed phenotype acute leukemia.
Cyclin D1 expression in AL
Cyclin D1 was positive in only 5.7% (2/35) cases of AL, while 94% (33/35) were found to be cyclin D1 negative. A minimum score of cyclin D1 expression was observed in undifferentiated AL, while a maximum score was seen in MPAL. None of the cases of ALL showed positive cyclin D1 expression. Only 1 case of AML M7 and 1 case of MPAL expressed cyclin D1 [Figure 2a]. The absence of cyclin D1 in all cases of ALL and 92.3% cases of AML was, however, statistically significant (P < 0.001). The expression of cyclin D1 was found to be significant with respect to age and gender, although no statistically significant difference was noted with WBC, platelet count and Hb level, organomegaly, and lymphadenopathy or blast percentage.
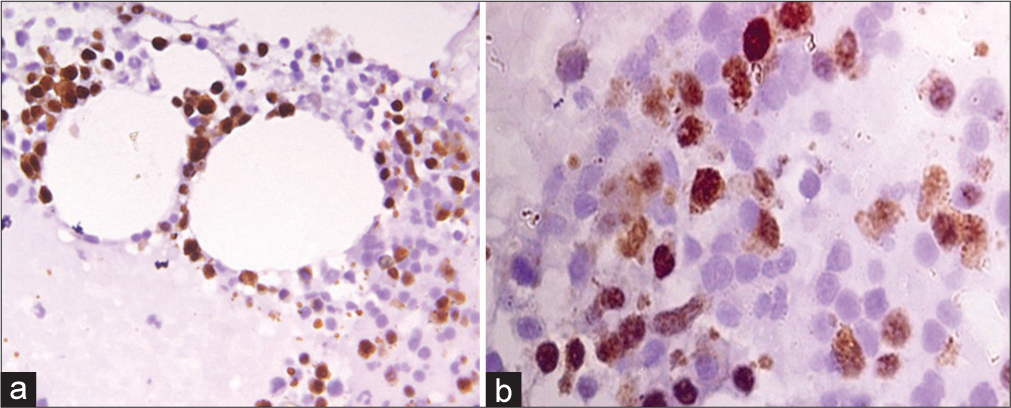
- (a) Representative core biopsy stained with cyclin D1 antibody-AML (FAB M7), Cyclin D1 score = 12, ×1000 magnification (b) Immunohistochemical stain for p53 in B-ALL, p53 score = 16, ×1000 magnification. AML: Acute myeloid leukemia, B-ALL: B-cell acute lymphoblastic leukemia.
p53 expression in AL
Of the 35 cases of AL, 43% (15/35) had p53 expression in blasts, while 57% had no expression. Among the cases with positive p53 expression, 53.8% of patients were aged 15–40 years, and a majority had splenomegaly (86.6%). However, the association of p53 was not significant with gender, age, organomegaly, or lymphadenopathy. Among ALL cases, 63.1% (12/19) had no expression of p53, while only seven cases revealed positive p53 expression [Figure 2b]. Two patients of T ALL were found to have equal distribution of p53. Among AML cases, positive expression of p53 was seen in FAB M1, M2, M3, M7, and both cases of MPAL; however, the association of p53 with subtypes was not statistically significant as a small group of patients was included in the study.
DISCUSSION
Expression of WT1, cyclin D1, and p53 was analyzed in AL patients. Tables 2a and b depict the expression of parameters with different variables. There are only a few studies in literature dealing with the expression of these proteins in AL, especially by IHC. In developing countries with limitations in resources, protein expression by IHC is very useful for practical application in laboratories that do not use modern molecular techniques. Few studies in the literature have identified WT1 as an independent adverse prognostic factor, a convenient minimal residual disease (MRD) marker, and a potential therapeutic target in AL, while other studies reveal no significant clinical impact of WT1 in AL. The findings in our study revealed WT1 expression in 31% of cases of AL, while 68% were found to be negative for WT1. Expression of WT1 was found to be equally distributed in ALL (31.5%) and AML (30.5%) cases. In a study by Al-Adnani et al.,[11] 40% of AML cases showed WT1 positivity by IHC as compared with a higher number of cases using reverse transcription polymerase chain reaction (RT-PCR). However, in the present study, WT1 expression in AML was found to be lower, which may be a consequence of the greater sensitivity of RT-PCR in the detection of WT1 as compared with IHC staining on paraffin-embedded material. Only a few studies have so far evaluated the relevance of WT1 expression in ALL. In the present study, 70.5% (12/17) of B ALL were found to be WT1 negative, while only five cases were found to have positive WT1 expression and this finding was found to be statistically significant (P = 0.0182). Due to the limited number of cases of T ALL, MPAL, and Undifferentiated AL in our patient population, the association of WT1 expression could not be correlated in these subgroups. Among the AML cases, positive WT1 expression was observed in one case each of M1, M2, M5, and M7, while no expression was observed in AML M3 (three cases), which was found to be statistically significant (P = 0.0253). As per the literature search, abnormality in WT1 expression in the majority of AL cases is only quantitative. Therefore, an exact method that enables sensitive detection with precise, preferably absolute, quantification of WT1 is a prerequisite for WT1 analysis in AL. It is probable that the inconsistent methodology contributed most of all to the discrepant results of our series. Hou et al. observed that WT1 mutations are closely associated with younger age.[4] Similarly, in the present study, WT 1 was significantly associated with male gender and younger age group (P = 0.006 and P = 0.0085, respectively). Among the clinical features, positive WT1 expression was significantly associated with bleeding manifestation and splenomegaly (P = 0.0493 and P = 0.0004) in the present study. An extensive literature search has revealed no significance of WT1 with clinical features, Hb, WBC count, and platelet count in AL, which is similar to observations in the present study. WT1 in AL is associated with resistance to therapy, a higher incidence of relapse, and poor overall survival; however, in the present series, due to limitations in follow-up of cases, the correlation of WT1 with MRD status and survival could not be established. In the present study, thus, we hypothesize that sensitive methods of detection of WT 1 and studies on a larger cohort of patients are needed to pinpoint the relevance of WT1 in AL, more so due to its complexity, both in terms of protein isoforms as well as the fact that it may participate in oncogenesis by way of either overexpression or loss-of-function mutations. Data on cyclin D1 expression in AL patients are still scarce and not yet clear. Overexpression of cyclin D1 in solid tumors including breast, hepatocellular, ovarian, and lung carcinomas,[12-15] non-Hodgkin’s lymphoma, and multiple myeloma are known;[9,16,17] however, studies concerning the expression of cyclin D1 in ALL are few and have rarely been reported in AML either at molecular or protein level. Aref et al.[9] have analyzed the expression of Cyclin D1 in AML; however, no single case of AML in their study revealed expression of cyclin D1, whereas, in only four out of ten ALL patients, the cyclin D1 levels were found to be overexpressed. In agreement with their study, we found that 92.3% of cases of AML were negative for cyclin D1 expression, and only one case of AML M7 and MPAL had positive expression of cyclin D1, which was not found to be significant. All cases of ALL in the present study did not express Cyclin D1, and this was statistically significant (P < 0.0001). Almost similar to the study by Ismail et al.[18] we found no correlation of cyclinD1 with Hb, WBC, and platelet count. A literature search reveals higher cyclin D1 expression in cases of ALL with the presence of lymphadenopathy and organomegaly; however, in the present study, this was not found to be significant. High cyclin D1 expression is associated with older age at the diagnosis, as per the study by Fernandes et al.[19] On the contrary, in the present study, increasing age was associated with negative cyclin D1 expression. Only two patients in the younger cohort, 0–15 years, expressed cyclin D1 in our study, and this association was significant (P < 0.0001). In view of the heterogeneity of the findings in the literature and our study, the prognostic value of cyclin D1 expression still needs to be validated in different cohorts of AL. TP53-mutated AML is known to be associated with an adverse prognosis and poor response to traditional chemotherapy regimens. Next-generation sequencing is considered the gold standard method to determine TP53-mutational status; however, molecular assays are costly and time-consuming. In contrast, IHC can be performed within one day of biopsy. Several groups have reported strong correlations between IHC and molecular testing in p53. IHC has emerged as a more rapid and cost-effective alternative that may be particularly useful in the early stage of the diagnostic process before molecular analysis. The expression of p53 by IHC in our study was found in 36.8% of cases of ALL, while in AML, 46.1% of cases revealed p53 protein expression. The study by Paydas[20] revealed p53 expression by IHC in 7/24 AML cases. Ruzinova et al.[21] have also studied the expression of p53 in 24 AML cases; however, they were able to detect mutation in only 21 cases by manual interpretation of IHC, with the remaining three cases that were falsely interpreted as negative due to truncating TP53 mutations that caused the protein not to be expressed. In the present study, p53 protein expression was distributed equally in AML subtypes and found to be negative in 7 cases (7/13), while only six cases were positive for p53. Similar to the study by Paydas[20], we found no correlation between the morphological type of AML and p53 expression. We found p53 expression in 7/19 cases of ALL, with the majority of B ALL expressing p53 protein (6/19), while only one case of T ALL revealed p53 expression. This association was, however, not significant due to the lesser number of cases in the present study group. As per Weng et al.[22], patients in the high-p53 expression group exhibited lower PB blast percentages and a higher platelet count with no significant association with sex, age, WBC count, and BM blasts. In agreement with this study, we found no correlation of p53 with above said parameters. In addition, no significant association of p53 with organomegaly, lymphadenopathy, Hb, and platelet count was found in the present study. Determining p53 expression by IHC shows remarkable inter-laboratory variability due to different cutoffs and different dilutions used for antibodies against p53, and thus, any interpretation of IHC expression should be validated with cases known to have abnormal TP53 mutation. Due to limitations in the availability of molecular studies, the p53 mutation could not be confirmed further in our cohort of patients. It is also important to note that our cohort contains relatively few cases with a positive p53 expression, and we did not test cutoffs with a validation set; the cutoffs used here should be used as general guidelines rather than as definitive values. The genome-wide studies to understand the complexities of WT1, cyclinD1 and p53 and its interaction in AL remains to be explored. The limitations of our study were the inclusion of a smaller number of patients, the unavailability of follow-up data, and the inability to perform molecular analysis due to a lack of infrastructure and financial constraints. In addition, it is likely that the effects of different isoforms of proteins studied, different methodologies, ethical and regional differences of our cohort from Western studies, and the role of cooperating genomic alterations in our patient population may have modified the results. Importantly, this recent work has highlighted the need to analyze the expression of WT1, cyclin D1, and p53 by utilizing multiple diagnostic modalities in a large group of patients. To the best of our knowledge, this is one of the few studies considering the expression of WT1, cyclin D1, and p53 in acute leukemia from North India.
| Variable | WT1 (n=35) | Cyclin D1 (n=35) | p53 (n=35) | ||||||
|---|---|---|---|---|---|---|---|---|---|
| Positive n=11 (31%) | Negative n=24 (68%) | P-value | Positive n=2 (5.7%) | Negative n=33 (94%) | P-value | Positive n=15 (43%) | Negative n=20 (57%) | P-valve | |
| Gender | |||||||||
| Male | 8/26 (30.7) | 18/26 (69.2) | 0.006 | 1/26 (3.8) | 25/26 (96.1) | <0.0001 | 10/26 (38.4) | 16/26 (61.5) | 0.099 |
| Female | 3/9 (33.3) | 6/9 (66.6) | 0.1694 | 1/9 (11.1) | 8/9 (88.8) | <0.0001 | 5/9 (55.5) | 4/9 (44.4) | 0.6502 |
| Age (Years) | |||||||||
| 0–15 | 5/18 (27.7) | 13/18 (72.2)) | 0.0085 | 2/18 (11.1) | 16/18 (88.8) | <0.0001 | 7/18 (38.8) | 11/18 (61.1) | 0.1871 |
| 15–40 | 4/13 (30.7) | 9/13 (69.2) | 0.0542 | 0 | 13 (100) | <0.0001 | 7/13 (53.8) | 6/13 (46.1) | 0.7002 |
| >40 | 2/4 (50) | 2/4 (50) | NA | 0 | 4 (100) | 0.0082 | 1/4 (25) | 3/4 (75) | 0.1859 |
| Clinical features | |||||||||
| Fever | 10/11 (90.9) | 22/24 (91.6) | 0.9462 | 2 (100) | 31/33 (93.9) | 0.7229 | 15 (100) | 18/20 (90) | 0.2138 |
| Bone pain | 3/11 (27.2) | 3/24 (12.5) | 0.2908 | 0 | 6/33 (18.1) | 0.5149 | 2/15 (13.3) | 4/20 (20) | 0.6078 |
| Bleeding | 6/11 (54.5) | 5/24 (20.8) | 0.0493 | 2 (100) | 13/33 (39.3) | 0.0968 | 8/15 (53.3) | 5/20 (25) | 0.091 |
| Hepatomegaly | 0 | 5/24 (20.8) | 0.1074 | 0 | 5/33 (15.1) | 0.5586 | 0 | 4/20 (20) | 0.0697 |
| Splenomegaly | 8/11 (72.7) | 3/24 (12.5) | 0.0004 | 1/2 (50) | 13/33 (39.3) | 0.7674 | 13/15 (86.6) | 12/20 (60) | 0.0894 |
| Lymphadenopathy | 3/11 (27.2) | 6/24 (25) | 0.8916 | 0 | 16/33 (48.4) | 0.1885 | 7/15 (46.6) | 8/20 (40) | 0.7003 |
| Hemogram | |||||||||
| Hb <10 g/dL | 10/11 (90.9) | 24 (100) | 0.1394 | 2 (100) | 32/33 (96.9) | 0.8033 | 15 (100) | 19/20 (95) | 0.3865 |
| Hb >10 g/dL | 1/11 (9) | 0 | 0.1417 | 0 | 1/33 (3.0) | 0.8065 | 0 | 1/20 (5) | 0.3865 |
| TLC <100×109/L | 10/11 (90.9) | 23/24 (95.8) | 0.5685 | 2 (100) | 31/33 (93.9) | 0.7229 | 15 (100) | 18/20 (90) | 0.2138 |
| TLC ≥100×109/L | 1/11 (9) | 1/24 (4.1) | 0.5653 | 0 | 2/33 (6.0) | 0.7252 | 0 | 2/20 (10) | 0.2138 |
| Platelet <30×109/L | 6/11 (54.5) | 13/24 (54.1) | 0.9827 | 2 (100) | 17/33 (51.5) | 0.1876 | 8/15 (53.3) | 10/20 (50) | 0.8489 |
| Platelet >30×109/L | 5/11 (45.4) | 11/24 (45.8) | 0.9218 | 0 | 16/33 (48.4) | 0.1885 | 7/15 (46.6) | 10/20 (50) | 0.8444 |
Hb: Hemoglobin, TLC: Total leukocyte count, WT 1: Wilms tumor 1 gene, NA: Not applicable.
| Variable | WT1 (n=35) | Cyclin D1 (n=35) | p53 (n=35) | ||||||
|---|---|---|---|---|---|---|---|---|---|
| Positive n=11 (31%) | Negative n=24 (68%) | P-value | Positive n=2 (5.7%) | Negative n=33 (94%) | P-value | Positive n=15 (43%) | Negative n=20 (57%) | P-value | |
| Diagnosis and subgroups | |||||||||
| ALL | 6/19 (31.5) | 13/19 (68.4) | 0.0248 | 0 | 19 (100) | <0.0001 | 7/19 (36.8) | 12/19 (63.1) | 0.1097 |
| B-ALL | 5/17 (29.4) | 12/17 (70.5) | 0.0182 | 0 | 17 (100) | <0.0001 | 6/17 (35.2) | 11/17 (64.7) | 0.0814 |
| T-ALL | 1/2 (50) | 1/2 (50) | NA | 0 | 2 (100) | 0.0833 | 1/2 (50) | 1/2 (50) | NA |
| AML | 4/13 (30.7) | 9/13 (69.2) | 0.0542 | 1/13 (7.6) | 12/13 (92.3) | <0.0001 | 6/13 (46.1) | 7/13 (53.8) | 0.7002 |
| M0 | 0 | 2 (100) | 0.0833 | 0 | 2 (100) | 0.0833 | 0 | 2 (100) | 0.0833 |
| M1 | 1/4 (25) | 3/4 (75) | 0.1859 | 0 | 4 (100) | 0.0082 | 2/4 (50) | 2/4 (50) | NA |
| M2 | 1 (100) | 0 | 0.3173 | 0 | 1 (100) | 0.3173 | 1 (100) | 0 | 0.3173 |
| M3 | 0 | 3 (100) | 0.0253 | 0 | 3 (100) | 0.0253 | 2/3 (66.6) | 1/3 (33.3) | 0.456 |
| M4 | 0 | 1 (100) | 0.3173 | 0 | 1 (100) | 0.3173 | 0 | 1 (100) | 0.3173 |
| M5 | 1 (100) | 0 | 0.3173 | 0 | 1 (100) | 0.3173 | 0 | 1 (100) | 0.3173 |
| M6 | 0 | 0 | NA | 0 | 0 | NA | 0 | 0 | NA |
| M7 | 1 (100) | 0 | 0.3173 | 1 (100) | 0 | 0.3173 | 1 (100) | 0 | 0.3173 |
| MPAL | 1/2 (50) | 1/2 (50) | NA | 1/2 (50) | 1/2 (50) | NA | 2 (100) | 0 | 0.0833 |
| Undifferentiated AL | 0 | 1 (100) | 0.3173 | 0 | 1 (100) | 0.3173 | 0 | 1 (100) | 0.3173 |
ALL: Acute lymphoblastic leukemia, B-ALL: B-cell acute lymphoblastic leukemia, T-ALL: T-cell acute lymphoblastic leukemia, MPAL: Mixed phenotype acute leukemia, WT1: Wilms’ tumor gene 1, AL: Acute leukemia, AML: Acute myeloid leukemia, MO: Undifferentiated, M1: Without maturation, M2: With maturation, M3: Acute promyelocytic, M4: Acute Myelomonocytic, M5: Acute monocytic, M6: Erthyroid leukemia, M7: Megakaryocytic, NA: Not applicable.
CONCLUSION
Diagnostic utility of WT1, cyclinD1 and p53 protein expression by IHC can be a valuable tool for determining prognosis in AL in resource limited settings. More sensitive molecular methods and studies on larger cohorts are needed to understand the complexities of these markers in acute leukemia.
Ethical approval
The authors declare that they have taken the Institutional Review Board approval and the approval number is 17/IEC/2018.
Declaration of patient consent
The authors certify that they have obtained all appropriate patient consent.
Conflicts of interest
There are no conflicts of interest.
Use of artificial intelligence (AI)-assisted technology for manuscript preparation
The authors confirm that there was no use of artificial intelligence (AI)-assisted technology for assisting in the writing or editing of the manuscript and no images were manipulated using AI.
Financial support and sponsorship
Nil.
References
- A study of leukemias profile in central India. Trop J Pathol Microbiol. 2018;4:1487-2456.
- [CrossRef] [Google Scholar]
- The Wilms tumor suppressor WT1 directs stage-specific quiescence and differentiation of human hematopoietic progenitor cells. EMBO J. 2001;20:1897-909.
- [CrossRef] [PubMed] [Google Scholar]
- Prognostic significance of diagnosed WT1 level in acute myeloid leukemia: A meta-analysis. Ann Hematol. 2015;94:929-38.
- [CrossRef] [PubMed] [Google Scholar]
- WT1 mutation in 470 adult patients with acute myeloid leukemia: Stability during disease evolution and implication of its incorporation into a survival scoring system. Blood. 2010;115:5222-31.
- [CrossRef] [PubMed] [Google Scholar]
- WT1 inhibits AML cell proliferation in a p53-dependent manner. Cell Cycle. 2021;20:1552-60.
- [CrossRef] [PubMed] [Google Scholar]
- Wilms' tumor gene 1 (WT1) expression in childhood acute lymphoblastic leukemia: A wide range of WT1 expression levels, its impact on prognosis and minimal residual disease monitoring. Leukemia. 2006;20:254-63.
- [CrossRef] [PubMed] [Google Scholar]
- A proposed kinetic model for the diagnostic and prognostic value of WT1 and p53 in acute myeloid leukemia. Clin Lab. 2018;64:357-63.
- [CrossRef] [PubMed] [Google Scholar]
- Cell-cycle regulation and hematologic disorders In: Williams hematology (9th ed). United States: McGraw Hill; 2015. p. :1-19.
- [Google Scholar]
- Cyclin D1 expression in acute leukemia. Hematology. 2006;11:31-4.
- [CrossRef] [PubMed] [Google Scholar]
- Expression of P-glycoprotein, Cyclin D1 and Ki-67 in acute lymphoblastic leukemia: Relation with induction chemotherapy and overall survival. Indian J Hematol Blood Transfus. 2011;27:157-63.
- [CrossRef] [PubMed] [Google Scholar]
- Immunohistochemical nuclear positivity for WT1 in childhood acute myeloid leukemia. Fetal Pediatr Pathol. 2007;26:193-7.
- [CrossRef] [PubMed] [Google Scholar]
- Cyclin D1 overexpression is a negative predictive factor for tamoxifen response in postmenopausal breast cancer patients. Br J Cancer. 2004;90:1942-8.
- [CrossRef] [PubMed] [Google Scholar]
- Overexpression of cyclin D1 is associated with poor survival in epithelial ovarian cancer. Oncology. 2004;66:310-5.
- [CrossRef] [PubMed] [Google Scholar]
- Expression of cyclin D1 but not of cyclin E is an indicator of poor prognosis in small adenocarcinomas of the lung. Oncol Rep. 2003;10:137-9.
- [CrossRef] [PubMed] [Google Scholar]
- A study of gene amplification and expression of cyclin D1 in hepatocellular carcinoma. Chin J Pathol. 2004;33:26-30.
- [Google Scholar]
- Different mechanisms of cyclin D1 overexpression in multiple myeloma revealed by fluorescence in situ hybridization and quantitative analysis of mRNA levels. Blood. 2004;104:1120-6.
- [CrossRef] [PubMed] [Google Scholar]
- Cyclin D1 overexpression is not a specific grouping marker, but may collaborate with CDC37 in myeloma cells. Int J Oncol. 2004;25:579-95.
- [CrossRef] [PubMed] [Google Scholar]
- Immunocytochemical studies of cyclin D1 and P16INK4a in acute lymphoblastic leukemic patients. J Am Sci. 2011;7:111-21.
- [Google Scholar]
- Increased levels of cyclin D1 negatively impact on acute lymphoblastic leukemia overall survival. Appl Cancer Res. 2018;38:7.
- [CrossRef] [Google Scholar]
- TP53 immunohistochemistry correlates with TP53 mutation status and clearance in decitabine-treated patients with myeloid malignancies. Haematologica. 2019;104:345-8.
- [CrossRef] [PubMed] [Google Scholar]
- Prognostic significance of the tumor suppressor protein p53 gene in childhood acute lymphoblastic leukemia. Oncol Lett. 2020;19:549-56.
- [CrossRef] [Google Scholar]