Translate this page into:
Red blood cell indices and cytokine levels in complicated pediatric Malaria in unstable malaria transmission area of Vihiga highlands, Kenya

*Corresponding author: Nathan Shaviya, Department of Medical Laboratory Sciences, Masinde Muliro University of Science and Technology, Kakamega, Kenya. shavianathan@gmail.com
-
Received: ,
Accepted: ,
How to cite this article: Jumba BN, Webale M, Makwali J, Shaviya N. Red blood cell indices and cytokine levels in complicated pediatric Malaria in unstable malaria transmission area of Vihiga highlands, Kenya. J Hematol Allied Sci. 2024;4:38-45. doi: 10.25259/JHAS_7_2024
Abstract
Objectives:
Complicated pediatric Malaria in unstable transmission regions presents a significant health challenge, necessitating a comprehensive understanding of the associated hematological and immunological alterations. This study aimed to investigate the hematological parameters, chemokine and cytokine response in children with complicated Malaria in an unstable malaria transmission region.
Material and Methods:
This cross-sectional study was conducted in Vihiga County, Western Kenya, a highland area with unstable malaria transmission. Three hundred and nine children with varied malaria phenotypes were recruited as follows: 82 healthy controls, 171 uncomplicated and 56 complicated malaria. Hematological indices and cytokine levels were measured across the clinical groups.
Results:
Children with complicated Malaria exhibited significantly lower hemoglobin levels (median, 6.5 g/dL) compared to uncomplicated Malaria (median, 9.9 g/dL) and healthy controls (median, 13.7 g/dL), P < 0.0001. Hematocrit, red blood cell count, mean corpuscular hemoglobin, mean corpuscular hemoglobin concentration, and platelets were also significantly reduced in complicated Malaria. Conversely, uncomplicated Malaria showed elevated mean corpuscular volume (MCV), while complicated Malaria had higher red cell distribution width, reticulocyte count, lymphocytes, monocytes, and mean platelet volume (MPV). White blood cell count was similar across groups. Regulated upon Activation, Normal T Cell Expressed and Presumably Secreted (RANTES), interleukin (IL)-8, IL-10, and IL-12 were significantly higher in complicated Malaria compared to uncomplicated Malaria and healthy controls. Conversely, macrophage inflammatory protein 1 alpha and macrophage inflammatory protein 1 beta were elevated in uncomplicated Malaria. IL-1β, IL-2, IL-5, IL-6, and interferon-gamma levels were elevated in complicated Malaria, while IL-4 was higher in healthy controls.
Conclusion:
This study’s results reveal key hematological derangements attributable to complicated Malaria. Hemoglobin, MCV, and MPV seem to be important markers in the characterization of malaria phenotypes. Moreover, complicated Malaria is associated with a dysregulated and exaggerated immune response.
Keywords
Complicated Malaria
Unstable transmission
Hematological indices
Cytokines

INTRODUCTION
Plasmodium falciparum parasite causes complicated Malaria.[1] This medical emergency can quickly lead to complications and death if not treated immediately. Malaria with major organ failures or blood or metabolic problems is called complicated Malaria.[2] Complicated Malaria causes cerebral Malaria, severe anemia, and metabolic acidosis.[3] Almost exclusively, P. falciparum causes complicated Malaria.[4]
Unstable malaria transmission in highlands can increase complicated malaria cases.[5] Malaria transmission is unstable due to climatic, seasonal, and ecological variables.[6] Highland malaria transmission irregularities can cause complicated Malaria. Unstable malaria transmission causes parasite exposure variability. Highland children may lose acquired immunity due to low malaria transmission.[7] In cases of increased transmission, the population may lack the immunity to combat malaria, resulting in higher rates of complicated malaria cases.[8] The irregular transmission of Malaria in highland regions can also alter immunological memory.[5] To respond quickly and effectively to reinfection, immune memory is essential. Children in unstable transmission areas may not build enough immunological memory, making them susceptible to more severe Malaria.[9] Anopheles mosquitoes are essential for malaria transmission.[6] Periods of low vector density followed by abrupt increases during peak transmission times can result from unstable malaria transmission.[7,8] Variations can cause unanticipated malaria outbreaks and a rise in complicated malaria cases.
Biomarkers, including immunological and hematological characteristics, can help diagnose complicated Malaria early.[10] Severe Malaria must be diagnosed quickly to avoid complications. Furthermore, complicated Malaria’s pathophysiology remains unknown. It involves complicated parasite-host immunological responses and hematological alterations. Investigation of these factors reveals the causes of severe disease.
MATERIAL AND METHODS
Study site and population
This study was a cross-sectional investigation in Vihiga County, Western Kenya, a highland location with unstable malaria transmission.[11,12] After a written informed agreement, 309 children (males, n = 170 and females, n = 139) were recruited as healthy controls “presumptively healthy” (n = 82), uncomplicated malaria (n = 171), and severe malaria (n = 56). Centers for Disease Control and Prevention definitions of complicated Malaria included severe malaria anemia, cerebral Malaria, and parasitemia with metabolic acidosis in children.[1] Cutoffs for anemia were 11.0 g/dL for 0.5–4.9 years, 11.5 g/dL for 5–11.9 years, and 12 g/dL for 12–14.9 years.[13,14]
Sample and data collection
Enrolment questionnaires, checklists, and data capture forms collected sociodemographic, anthropometric, and clinical data. By venipuncture, 5 mL of venous blood was collected into heparinized green top BD vacutainer tubes (BD, UK). For hemoglobin and plasmodium species microscopy, finger-prick blood samples were taken.
Determination of parasitemia
Parasitemia was measured by counting asexual stage parasites per 200 white blood cells (WBCs) in blood smears stained with 3% Giemsa. A minimum of 200 high-power fields verified P. falciparum parasitemia microscopically. Malaria complications were diagnosed by erythrocyte morphology, cell size, shape, and staining pattern.
Hematological analysis
Beckman Coulter AcT diff2 hematology analyzers (GMI, US) performed complete blood counts(CBCs). The measurements included WBC, red blood cell (RBC) (×106/mL), hemoglobin (g/dL), hematocrit (%), mean corpuscular volume (MCV) (fL), mean corpuscular hemoglobin (MCH) (pg), mean corpuscular hemoglobin concentration (MCHC) (g/dL), red cell distribution width (RDW) (%), reticulocyte count (%), WBC (×109/L), lymphocytes (×109/L), monocytes (×109/L), platelets (×109/L), and mean platelet volume (MPV). The parasitemia density per µL of blood was calculated using the formula: (parasites/300) × (WBCs/µL). Samples of plasma and serum were aliquoted into cryovials and stored at –70°C until use. May 2020, October 2020, December 2020, and April 2021 hemoglobin samples were taken at every time point. Photometry measured hemoglobin (hemo Control; EKF Diagnostics).
Isolation of peripheral mononuclear cells. Within 6 hours (h) of phlebotomy, density gradient centrifugation extracted peripheral blood mononuclear cells (PBMC) from whole blood. Ficoll-Hypaque density gradient centrifugation isolated the cells. For 30 min, anti-coagulated blood was carefully placed onto 5 mL of Ficoll-Hypaque in 1.5 mL tubes and centrifuged at 1500 rpm. From the buffy coat layer (containing mononuclear cells), a 10 mL pipette was used to collect PBMC into a 1.5 mL tube. The cells were rinsed with 12 mL of sterile phosphate-buffered saline (PBS) at PH 7.0 without calcium or magnesium. Next, they were centrifuged at 1300 rpm for 15 min at room temperature. Aspirate the supernatant, break the pellets with a light flick, and resuspend them in 2 mL complete DMEM with 1% FBS, HEPES (25 nmoL), L-glutamine (2 nmoL), and penicillin-streptomycin (100 U/mL) for 8 days. Using a hemocytometer, the cells were stained with 10 mL trypan blue 1:1 and counted. Microsoft Excel sheets were used to calculate cell counts and dilute them to 2 × 10⁵ cells/well for the test and cell culture. PBMCs were resuspended in full RPMI 1640 culture media. After stimulation with peptides, 2 × 10⁵ cells per well were cultivated in 96 well-round bottom plates at 37°C in 5% CO2 humidity for 120 h. Harvested supernatants were kept at 80oC for Bioplex assay cytokine testing.
Cytokine measurements
The cytokine 8-plex conjugated bead (25×) stock solution was vortexed as a working dilution of the anti-cytokine bead in a 96-well bioplex assay buffer. Millipore microtiter plates (Millipore Corporation, Billerica, MA) were prewetted with 100 µL Bioplex assay buffer per well and aspirated using a Millipore vacuum manifold. Next, 50 µL of the working bead solution was applied to the plate wells and aspirated using a Millipore vacuum funnel. To each well, 100 µL of bioplex wash buffer was added and aspirated. Add 50 µL of standard or sample to the wells, place the plate on a microplate shaker (Wilmington, NC) for 30 min at room temperature(RT), and gently mix. Plates were aspirated with a Millipore vacuum funnel to remove supernatant and washed 3 times with 100 µL of BioPlex wash buffer per well. In BioPlex detection antibody diluent, a 10× detection antibody stock solution was diluted. The detection antibody solution was vortexed, 25 µL added to each well, and incubated at RT for 30 min on a microplate shaker. Aspirate 100 µL of BioPlex wash buffer each well, wash the plate three times, and aspirate again to remove the wash buffer. Prepared a 100× working dilution of streptavidin-PE stock solution in bioplex assay buffer. Add 50 µL to each well and incubate for 10 min at RT on the microplate shaker. Aspiration was used to remove the buffer, followed by three washes with 100 µL of BioPlex wash buffer per well and another aspiration. To quantify cytokines, beads were resuspended in 125 µL of BioPlex assay solution per well, briefly mixed, and read on the BioPlex 200 system (Hercules, CA). By indirect enzyme-linked immunosorbent assay (ELISA) (Invitrogen, USA), plasma and culture supernatant cytokines were evaluated at days 0 and 14. To reduce test variability, batch analyses were performed for cytokine levels. ELISA was used to measure cytokine acquisition.[15] Recombinant antigens (Wellcome genotype) were diluted to 5 µg/mL in PBS (50 µL/well) and incubated overnight at four °C on 96 well plates (maxisorp). After washing the plates four times with PBS and 0.05% Tween 20, they were blocked for 2 h with 200 µL of 1% (wt/vol) non-fat dry milk powder in PBS/T. In duplicate, each plate received positive controls (hyperimmune serum) and negative controls (non-immune resident serum). Plates were washed four times (Dako, Roskilde, Denmark), diluted 1:5,000 in PBS/T and applied to all wells with horseradish peroxidase (HRP)-conjugated streptavidin. Wells were emptied and rinsed four times with a wash buffer after incubation. Develop plates for 20 min with TMB substrate solution. Stopping reactions using two mol/L H2SO4. Plates were promptly examined at 450 nm, and optical density (OD) values recorded. Malaria-naïve and malaria-exposed individuals were used as negative and positive controls to determine the cutoff values for each antigen. Positive samples had OD greater than the mean + two standard deviations of the negative control plasma.
Ethical consideration
This protocol was approved by Masinde Muliro University of Science and Technology Institutional Ethical Review Committee (MMUST-IREC) protocol number MMUST/IERC/021/2021. The National Council on Science and Technology (NACOSTI) license number NACOSTI/P/21/14703 authorized the study. All participants signed consent forms.
Statistical analysis
Prism 7 statistical software (GraphPad Software, La Jolla, California, USA, www.graphpad.com) was used to analyze data. Medians and interquartile ranges show age, gender, red cell count, and cytokine levels. Comparisons were made between groups using the Kruskal–Wallis test, with Bonferroni correction at P < 0.017. Categorical variables were compared using Chi-square test. Statistical significance was defined as P < 0.05.
RESULTS
Demographic and clinical characteristics
Table 1 shows the study participants’ demographic and clinical features. There were 309 children, 82 (26.5%) malaria-free, and 227 (73.5%) malaria-infected. Malaria-infected subjects had 171 (75.3%) simple malaria and 56 (24.7%) severe malaria. Complicated malaria patients were younger (median, 8.5; interquartile range [IQR] 5 months; P = 0.014). Study groups likewise had similar gender distribution (P = 0.621). Clinical groups had similar axillary temperatures (P = 0.418). Fever was found in 92% and 96% of uncomplicated and complicated malarial children. Uncomplicated (74%) and complicated (73%) children had low feeding/appetite. Complicated Malaria caused 39% of children to have generalized pallor, compared to 9% of uncomplicated malaria patients. Jaundice rates were higher in children with complicated Malaria (13% vs. 2%). The complications malaria study group exhibited higher coughing and diarrhea than the simple malaria group. Convulsion was only documented in children with complicated Malaria.
| Characteristic | HC, n=82 | UM, n=171 | CM, n=56 | P |
|---|---|---|---|---|
| Age, mos | 10.0 (9.0) | 11.5 (10.0) | 8.5 (7.0) | 0.014 |
| Male gender, no. (%) | 47 (57) | 92 (54) | 31 (55) | 0.621 |
| Auxiliary temp, °C | 37.5 (2.1) | 37.6 (1.4) | 37.3 (1.3) | 0.418 |
| Fever, no. (%) | 0 (0) | 158 (92) | 54 (96) | - |
| Jaundice, no. (%) | 0 (0) | 4 (2) | 7 (13) | - |
| Edema, no. (%) | 0 (0) | 0 (0) | 1 (2) | - |
| Generalized pallor, no. (%) | 0 (0) | 15 (9) | 22 (39) | - |
| Poor feeding, no. (%) | 0 (0) | 126 (74) | 41 (73) | - |
| Cough, no. (%) | 0 (0) | 29 (17) | 17 (30) | - |
| Diarrhea, no. (%) | 0 (0) | 38 (22) | 14 (25) | - |
| Convulsion, no. (%) | 0 (0) | 0 (0) | 2 (4) | - |
| Unresponsiveness, no. (%) | 0 (0) | 0 (0) | 0 (0) | - |
Data or numbers (n) and percentages (%) of study subjects. Data for age and axillary temperature are presented as medians ( Interquartile range [IQR]). HC: Healthy controls, UM: Uncomplicated Malaria, CM: Complicated Malaria. Data analysis was conducted using the Kruskal–Wallis H test for continuous data. Values in bold are significant P-values, n: Numbers
Hematological profiles of the study participants
Table 2 shows the study participants’ hematological indicators. Complicated Malaria in children resulted in considerably lower hemoglobin levels (P < 0.0001) compared to uncomplicated Malaria (median, 9.9; IQR 3.6 g/dL) and healthy controls (median, 13.7; IQR 2.2 g/dL). Post hoc analyses showed decreased hematocrit, RBC count, MCH, MCHC, and platelets in complicated malaria patients compared to uncomplicated Malaria and healthy controls (median, 29.5; IQR, 7.3%; P < 0.017). Children with uncomplicated Malaria had a substantially higher MCV (median, 76.2; IQR 8.8 fL) than those with complicated Malaria (71.1; IQR 13.3fL). In addition, complicated malaria patients had lower MCV levels than healthy controls (median, 75.2; IQR 5.6fL vs. median, 71.1; IQR 13.3 fL). In contrast, the complicated malaria group had higher RDW, reticulocyte count, lymphocytes, monocytes, and MPV compared to other study groups (median, 24.0; IQR, 4.6%; P < 0.017). Three clinical groups had similar WBC counts (P = 0.068).
| Index | HC | UM | CM | P |
|---|---|---|---|---|
| Hemoglobin (g/dL) | 13.7 (2.2) | 9.9 (3.6) | 6.5 (3.5) | <0.0001c |
| Hematocrit (%) | 47.6 (6.9) | 34.0 (5.2) | 29.5 (7.3) | <0.0001c |
| RBC (×106/mL) | 5.3 (1.1) | 4.8 (1.0) | 2.2 (0.7) | <0.0001c |
| MCV (fL) | 75.2 (5.6) | 76.2 (8.8) | 71.1 (13.3) | <0.0001c |
| MCH (pg) | 33.3 (4.3) | 25.1 (3.9) | 23.0 (3.8) | <0.0001c |
| MCHC (g/dL) | 34.9 (2.4) | 33.3 (1.9) | 31.8 (2.1) | <0.0001c |
| RDW (%) | 16.7 (1.6) | 17.4 (5.0) | 24.0 (4.6) | <0.0001a |
| Reticulocyte count (%) | 1.1 (0.6) | 1.7 (0.9) | 3.3 (1.7) | <0.0001a |
| WBC (×109/L) | 11.7 (4.9) | 12.3 (7.5) | 14.0 (6.8) | 0.068 |
| Lymphocytes (×109/L) | 2.6 (1.3) | 4.3 (2.1) | 5.6 (3.9) | <0.0001a |
| Monocytes (×109/L) | 0.7 (0.6) | 1.1 (0.8) | 1.4 (1.1) | <0.0001a |
| Platelets (×109/L) | 232 (57) | 225 (52) | 137 (35) | <0.0001c |
| MPV (fL) | 6.7 (2.5) | 7.4 (1.1) | 8.8 (1.5) | <0.0001a |
Data analysis was conducted using the Kruskal–Wallis test across groups with post hocMann–Whitney U-test between group comparison and Bonferroni correction set at P<0.017. Significantly lower comparisons between clinical groups are indicated as a P<0.017 versus HC, UM, and CM, b P<0.017 versus UM, HC, and CM, and c P<0.017 versus CM, HC, and UM. HC: Healthy controls, UM: Uncomplicated Malaria, CM: Complicated Malaria, WBC: White blood cell, RBC: Red blood cell, MCV: Mean corpuscular volume, MCH: Mean corpuscular hemoglobin, MCHC: Mean corpuscular hemoglobin concentration, RDW: Red cell distribution width, MPV: Mean platelet volume
Serum cytokines levels
Figures 1 and 2 show study participants’ circulating cytokines. Figure 1 shows box plots for Regulated upon Activation, Normal T Cell Expressed and Presumably Secreted (RANTES), macrophage inflammatory protein 1 alpha (MIP1-α), macrophage inflammatory protein 1 beta (MIP1-β), IL-8, IL-10, and IL-12. Figure 2 shows IL-1β, IL-2, IL-4, IL-5, IL-6, and interferon gamma (IFN-ɤ) plots. Serum RANTES levels were substantially higher (P < 0.0001) in children with complicated Malaria (median, 20281.23; IQR 1019 pg/mL) compared to uncomplicated Malaria (median, 17267.73; IQR, 883 pg/mL) and healthy controls (median, 15801.31; IQR, 507 pg/mL IL-8 complicated Malaria (median, 32.06; IQR 11.5 pg/mL), uncomplicated Malaria (median, 16.05; IQR 8.7 pg/mL), healthy controls (median, 6.24; IQR 4.4 pg/mL), IL-10 complicated Malaria (median, 89.1; IQR 166.5 pg/mL), and uncomplicated Malaria. In contrast, children with uncomplicated Malaria had significantly higher levels of MIP1-α (median, 115.0; IQR 121.6 pg/mL) and MIP1-β (median, 286.0; IQR, 408.2 pg/mL) (P = 0.002 and P < 0.0001). IL-1β levels were higher in children with complicated Malaria (median, 3.47; IQR, 3.3 pg/mL) compared to uncomplicated Malaria (median, 2.56; IQR 2.1 pg/mL) and healthy controls (median, 1.93; IQR 0.9 pg/mL) (P < 0.0001). In complicated Malaria, IL-2, IL-5, IL-6, and IFN-ɤ levels were high (median, 1.71; IQR, 0.8 pg/mL; P < 0.0001; median, 1.82; IQR, 2.2 pg/mL; P < 0.0001; median, 171.7; IQR, 22.3 pg/mL; P < 0.0001; median, 102.0; IQR, 132.5 pg/mL; P < 0.0001). Healthy controls had significantly higher IL-4 levels (24.1; IQR 25.6 pg/mL) compared to uncomplicated and complicated malaria groups (median, 12.0; IQR 44.3 pg/mL and 12.6; IQR 16.8 pg/mL, respectively, P < 0.0001).
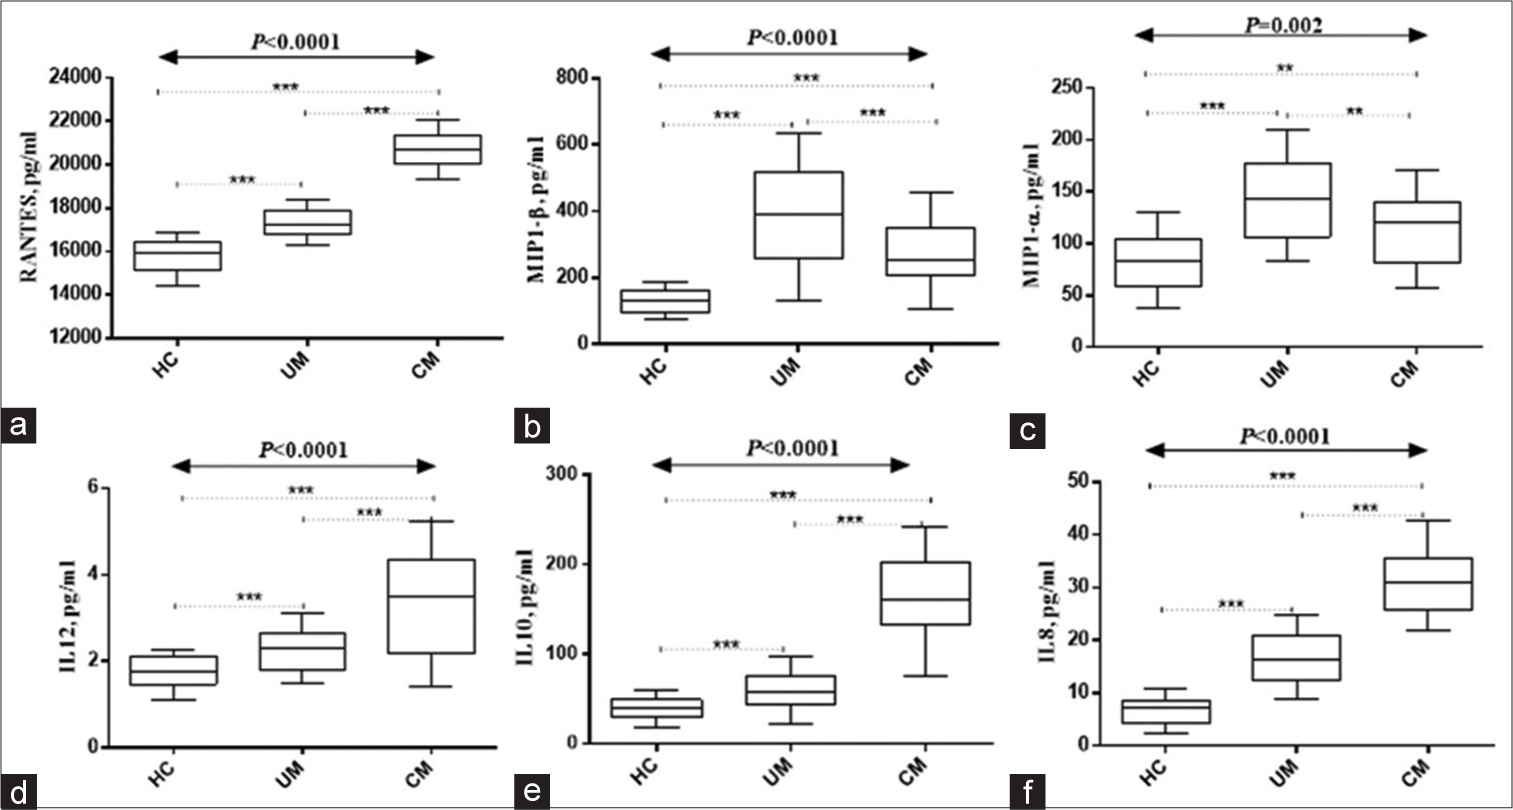
- Serum levels of (a) Regulated upon Activation, Normal T Cell Expressed and Presumably Secreted (RANTES), (b)MIP1-α, (c) MIP1-β, (d)IL-12, (e)IL-10, and (f)IL-8. HC: Healthy controls, UM: Uncomplicated Malaria, CM: Complicated Malaria. Data was analyzed using the Kruskal–Wallis H-test. Post hoc analyses done using Bonferroni correction set at P < 0.017). IL: Interleukin, MIP1-α: Macrophage inflammatory protein 1 alpha, MIP1: Macrophage inflammatory protein 1 beta , ***Refers to P < 0.0001, **Refers to P < 0.001.
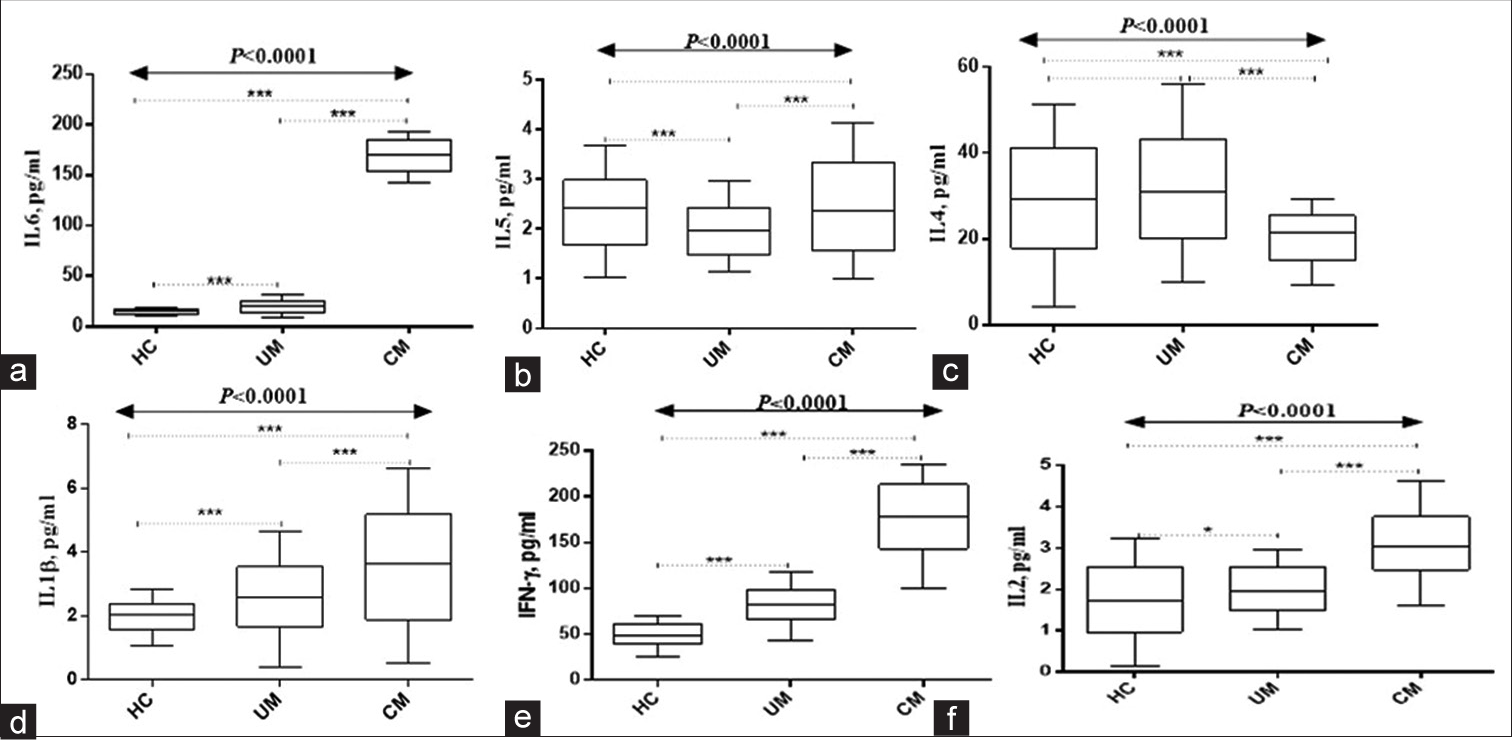
- Serum levels of (a)IL-6, (b)IL-5, (c)IL-4, (d)IL-1β, (e) INF-ɤ, and (f)IL-2. HC: Healthy controls. UM: Uncomplicated malaria, CM: Complicated malaria. Data analyzed using Kruskal–Wallis H-test. Post hoc analyses done using Bonferroni correction set at P < 0.017). IL: Interleukin, INF-ɤ: Interferon gamma, ***Refers to P < 0.0001, *Refers to P < 0.05.
DISCUSSION
Children with complicated Malaria were younger in this study. Some malaria characteristics are more severe in younger children.[16,17] Children with underdeveloped immune systems, lower RBC complement regulatory protein levels, and a higher risk of cerebral Malaria and severe anemia are more susceptible to severe Malaria.[18,19] This makes serious infections more likely. Although gender distribution was similar across research groups, gender did not affect complicated Malaria.[20] Axillary temperature was similar across clinical groups, showing fever was a prevalent symptom in both uncomplicated and severe malaria cases. Other investigations have found fever as a common malaria symptom.[21,22] Furthermore, most children with uncomplicated and severe Malaria had poor nutrition or hunger. As previously noted, Malaria can cause low appetite.[20,23] Children with complicated Malaria had more generalized pallor than those with uncomplicated Malaria. Malaria-infected children are more likely to become anemic.[14,24] Compared to uncomplicated Malaria, complicated malaria children had higher jaundice rates. Lopez-Perez et al., in 2016, found liver illnesses as a clinical sign of complicated Malaria.[25] Compared to uncomplicated Malaria, the complicated malaria study group reported greater coughing and diarrhea. Other investigations have found respiratory and gastrointestinal symptoms in malaria patients.[25,26] Convulsion was only documented in children with complicated Malaria. Similar investigations have linked severe Malaria to convulsions.[2,25] These results shed light on the clinical signs of simple and complicated Malaria in children. Correct malaria diagnosis and treatment require knowledge of its clinical presentation.
Children with complicated Malaria had considerably lower hemoglobin levels than those with simple Malaria and healthy controls. Earlier investigations have found reduced hemoglobin levels in malaria patients.[27,28] More children with complicated Malaria had thrombocytopenia or decreased platelet counts. Previous malaria studies have found thrombocytopenia.[28,29] Compared to uncomplicated Malaria and healthy controls, children with complicated Malaria showed reduced hematocrit, RBC count, MCH, and MCHC. Former studies have found similar hematological alterations in malaria-infected patients.[27,29] MCV was higher in children with uncomplicated Malaria than in those with complicated Malaria and healthy controls. The earlier study by Kotepui et al. found reduced MCV in malaria-infected patients.[28] Study demographics and methods may explain the differences. Further, complicated malaria children exhibited greater RDW, reticulocyte count, lymphocytes, monocytes, and MPV than other study groups. The increased RDW, reticulocyte count, and WBC count in malaria-infected patients are consistent with earlier investigations.[28,30] These findings support the hematological alterations associated with complicated malaria infection. Hematological parameters can be biomarkers for illness severity and treatment response, making these alterations crucial for malaria diagnosis and therapy.
The interaction between immune cells and cytokines is crucial for understanding both the pathogenesis and early prevention of Malaria. Although cytokines are responsible for facilitating the immune system’s elimination of parasites, their dysregulation can worsen the condition.[10] RANTES levels were considerably higher in children with complicated Malaria than in simple Malaria and healthy controls, according to Ochiel et al.[31] The current study confirms elevation of RANTES in malaria patients as revealed by previous studies. The rise of RANTES, a chemokine that recruits and activates immune cells, in complicated Malaria shows an immune response dysregulation. Related investigations have found elevated RANTES in complicated Malaria.[15,32] Conversely, MIP1-α and MIP1-β levels were considerably higher in children with uncomplicated Malaria compared to those with complicated Malaria. The previous research in uncomplicated Malaria[31,33] supports this conclusion by indicating elevated MIP1-α and MIP1-β levels. Monocytes and other immune cells are recruited and activated by MIP1-α and MIP1-β chemokines. In uncomplicated Malaria, elevated chemokines may signal a better immunological response.
Complications of Malaria increased IL-8, IL-10, and IL-12 levels in children compared to simple Malaria and healthy controls. Similar investigations have found elevated cytokines in complicated Malaria.[34-36] IL-8 draws neutrophils to infection sites, while IL-10 suppresses immune responses as an anti-inflammatory cytokine. IL-12 activates T and NK cells. In complicated Malaria, these cytokines indicate immunological dysregulation and inflammation.
A study indicated that children with complicated Malaria had higher levels of IL-1β, IL-2, IL-5, IL-6, and IFN-ɤ compared to healthy controls. According to the earlier study, complicated Malaria increases these cytokines.[13,33] Proinflammatory cytokine IL-1β initiates immunological responses. Immune cells are activated and regulated by cytokines such as IL-2, IL-5, IL-6, and IFN-γ. Complicated Malaria increases these cytokines, indicating an inflammatory immune response.
The results of this investigation support prior findings that complicated Malaria causes dysregulated immune responses and inflammation. In complicated Malaria, elevated RANTES, IL-8, IL-10, and IL-12 indicate a dysregulated immune response, whereas elevated MIP1-α, MIP1-β, IL-1β, IL-2, IL-5, IL-6, and IFN-ɤ indicate overactive immunological response and inflammation.
CONCLUSION
This study’s results reveal key hematological derangements attributable to complicated Malaria. Hemoglobin, MCV, and MPV seem to be important markers in the characterization of malaria phenotypes. Moreover, complicated Malaria is associated with a dysregulated and exaggerated immune response.
Recommendations
Enhance malaria diagnosis and management by incorporating hematological characteristics associated with complicated Malaria, such as lower hemoglobin levels and altered RBC parameters, highlighting the importance of early diagnosis and appropriate management. Health systems should ensure access to accurate and timely diagnostic tools and effective antimalarial treatments.
Monitor and manage cytokine responses in complicated malaria patients. The elevated levels of proinflammatory and anti-inflammatory cytokines in complicated Malaria indicate dysregulated immune responses. Further research is needed to understand the role of cytokines in disease progression and to develop targeted interventions to modulate the immune response.
Acknowledgment
We thank the study participants, parents/guardians, and Vihiga County Referral Hospital.
Ethical approval
The research/study approved by the Institutional Review Board at Masinde Muliro University of Science and Technology, number MMUST/IERC/021/2021, dated October 8, 2021.
Declaration of patient consent
The authors certify that they have obtained all appropriate patient consent.
Conflicts of interest
There are no conflicts of interest.
Use of artificial intelligence (AI)-assisted technology for manuscript preparation
The authors confirm that there was no use of artificial intelligence (AI)-assisted technology for assisting in the writing or editing of the manuscript and no images were manipulated using AI.
Financial support and sponsorship
Nil.
References
- 2022. Available from: https://www.cdc.gov/malaria/about/disease [Last accessed on 2024 Jan 20]
- Clinical and epidemiological aspects of complicated Malaria in Colombia, 2007-2013. Malar J. 2016;15:269.
- [CrossRef] [PubMed] [Google Scholar]
- The treatment of complicated and severe Malaria. Br Med Bull. 2006;75-76:29-47.
- [CrossRef] [PubMed] [Google Scholar]
- Investigating the pathogenesis of severe Malaria: A multidisciplinary and cross-geographical approach. Am J Trop Med Hyg. 2015;93(3 Suppl):42-56.
- [CrossRef] [PubMed] [Google Scholar]
- Highland malaria transmission dynamics in space and time before pre-elimination era, northwest Ethiopia. J Epidemiol Glob Health. 2022;12:362-71.
- [CrossRef] [PubMed] [Google Scholar]
- Impact of highland topography changes on exposure to malaria vectors and immunity in western Kenya. Front Public Health. 2016;4:227.
- [CrossRef] [PubMed] [Google Scholar]
- Malaria in Kenya's western highlands. Emerg Infect Dis. 2005;11:1425-32.
- [CrossRef] [PubMed] [Google Scholar]
- Malaria in East African highlands during the past 30 years: Impact of environmental changes. Front Physiol. 2012;3:315.
- [CrossRef] [PubMed] [Google Scholar]
- Development of B cell memory in Malaria. Front Immunol. 2019;10:559.
- [CrossRef] [PubMed] [Google Scholar]
- The spectrum of clinical biomarkers in severe Malaria and new avenues for exploration. Virulence. 2022;13:634-53.
- [CrossRef] [PubMed] [Google Scholar]
- Molecular screening reveals non-uniform malaria transmission in western Kenya and absence of Rickettsia africae and selected arboviruses in hospital patients. Malar J. 2022;21:268.
- [CrossRef] [PubMed] [Google Scholar]
- Spatio-temporal distribution of malaria parasites in Vihiga County, Western Kenya. Egypt Acad J Biol Sci E Med Entomol Parasitol. 2022;14:199-211.
- [CrossRef] [Google Scholar]
- Severe Malarial anemia: Innate immunity and pathogenesis. Int J Biol Sci. 2011;7:1427-42.
- [CrossRef] [PubMed] [Google Scholar]
- RANTES levels as a determinant of falciparum malaria severity or recovery. Parasite Immunol. 2017;39
- [CrossRef] [PubMed] [Google Scholar]
- Age-patterns of Malaria vary with severity, transmission intensity and seasonality in sub-Saharan Africa: A systematic review and pooled analysis. PLoS One. 2010;5:e8988.
- [CrossRef] [PubMed] [Google Scholar]
- Age-related changes in malaria clinical phenotypes during infancy are modified by sickle cell trait. Clin Infect Dis. 2021;73:1887-95.
- [CrossRef] [PubMed] [Google Scholar]
- Pathogenicity and virulence of Malaria: Sticky problems and tricky solutions. Virulence. 2023;14:2150456.
- [CrossRef] [PubMed] [Google Scholar]
- Malaria and under-nutrition: A community based study among under-five children at risk of Malaria, South-West Ethiopia. PLOS One. 2010;5:e10775.
- [CrossRef] [PubMed] [Google Scholar]
- Precision identification of high-risk phenotypes and progression pathways in severe Malaria without requiring longitudinal data. NPJ Digit Med. 2019;2:63.
- [CrossRef] [PubMed] [Google Scholar]
- The apicoplast link to fever-survival and artemisinin-resistance in the malaria parasite. Nat Commun. 2021;12:4563.
- [CrossRef] [PubMed] [Google Scholar]
- Prevalence of Malaria among acute febrile patients clinically suspected of having Malaria in the Zeway Health Center, Ethiopia. Jpn J Infect Dis. 2015;68:55-9.
- [CrossRef] [PubMed] [Google Scholar]
- The clinical profile of severe pediatric Malaria in an area targeted for routine RTS, S/AS01 malaria vaccination in Western Kenya. Clin Infect Dis. 2020;71:372-80.
- [CrossRef] [PubMed] [Google Scholar]
- Malaria in pregnancy: A passive surveillance study of pregnant women in low transmission areas of Colombia, Latin America. Malar J. 2016;15:66.
- [CrossRef] [PubMed] [Google Scholar]
- Malaria: Uncomplicated, caused by Plasmodium falciparum. BMJ Clin Evid. 2008;2008:919.
- [Google Scholar]
- Profiles of hematological parameters in Plasmodium falciparum and Plasmodium vivax malaria patients attending Tercha General Hospital, Dawuro Zone, South Ethiopia. Infect Drug Resist. 2019;12:521-7.
- [CrossRef] [PubMed] [Google Scholar]
- Effect of malarial infection on haematological parameters in population near Thailand-Myanmar border. Malar J. 2014;13:218.
- [CrossRef] [PubMed] [Google Scholar]
- Profile of hematological parameters in plasmodium falciparum malaria: A study from West Bengal. J Hematol Allied Sci. 2021;1:28-32.
- [CrossRef] [Google Scholar]
- Differential regulation of β-chemokines in children with Plasmodium falciparum malaria. Infect Immun. 2005;73:4190-7.
- [CrossRef] [PubMed] [Google Scholar]
- Low levels of RANTES are associated with mortality in children with cerebral Malaria. J Infect Dis. 2006;194:837-45.
- [CrossRef] [PubMed] [Google Scholar]
- Increased levels of inflammatory mediators in children with severe Plasmodium falciparum malaria with respiratory distress. J Infect Dis. 2006;194:1438-46.
- [CrossRef] [PubMed] [Google Scholar]
- Relation between increased IL-10 levels and malaria severity: A systematic review and meta-analysis. Trop Med Infect Dis. 2023;8:35.
- [CrossRef] [PubMed] [Google Scholar]
- The ability of Interleukin-10 to negate haemozoin-related pro-inflammatory effects has the potential to restore impaired macrophage function associated with malaria infection. Malar J. 2023;22:125.
- [CrossRef] [PubMed] [Google Scholar]
- Low interleukin-12 levels concerning severe Malaria: A systematic review and meta-analysis. Int J Environ Res Public Health. 2022;19:9345.
- [CrossRef] [PubMed] [Google Scholar]